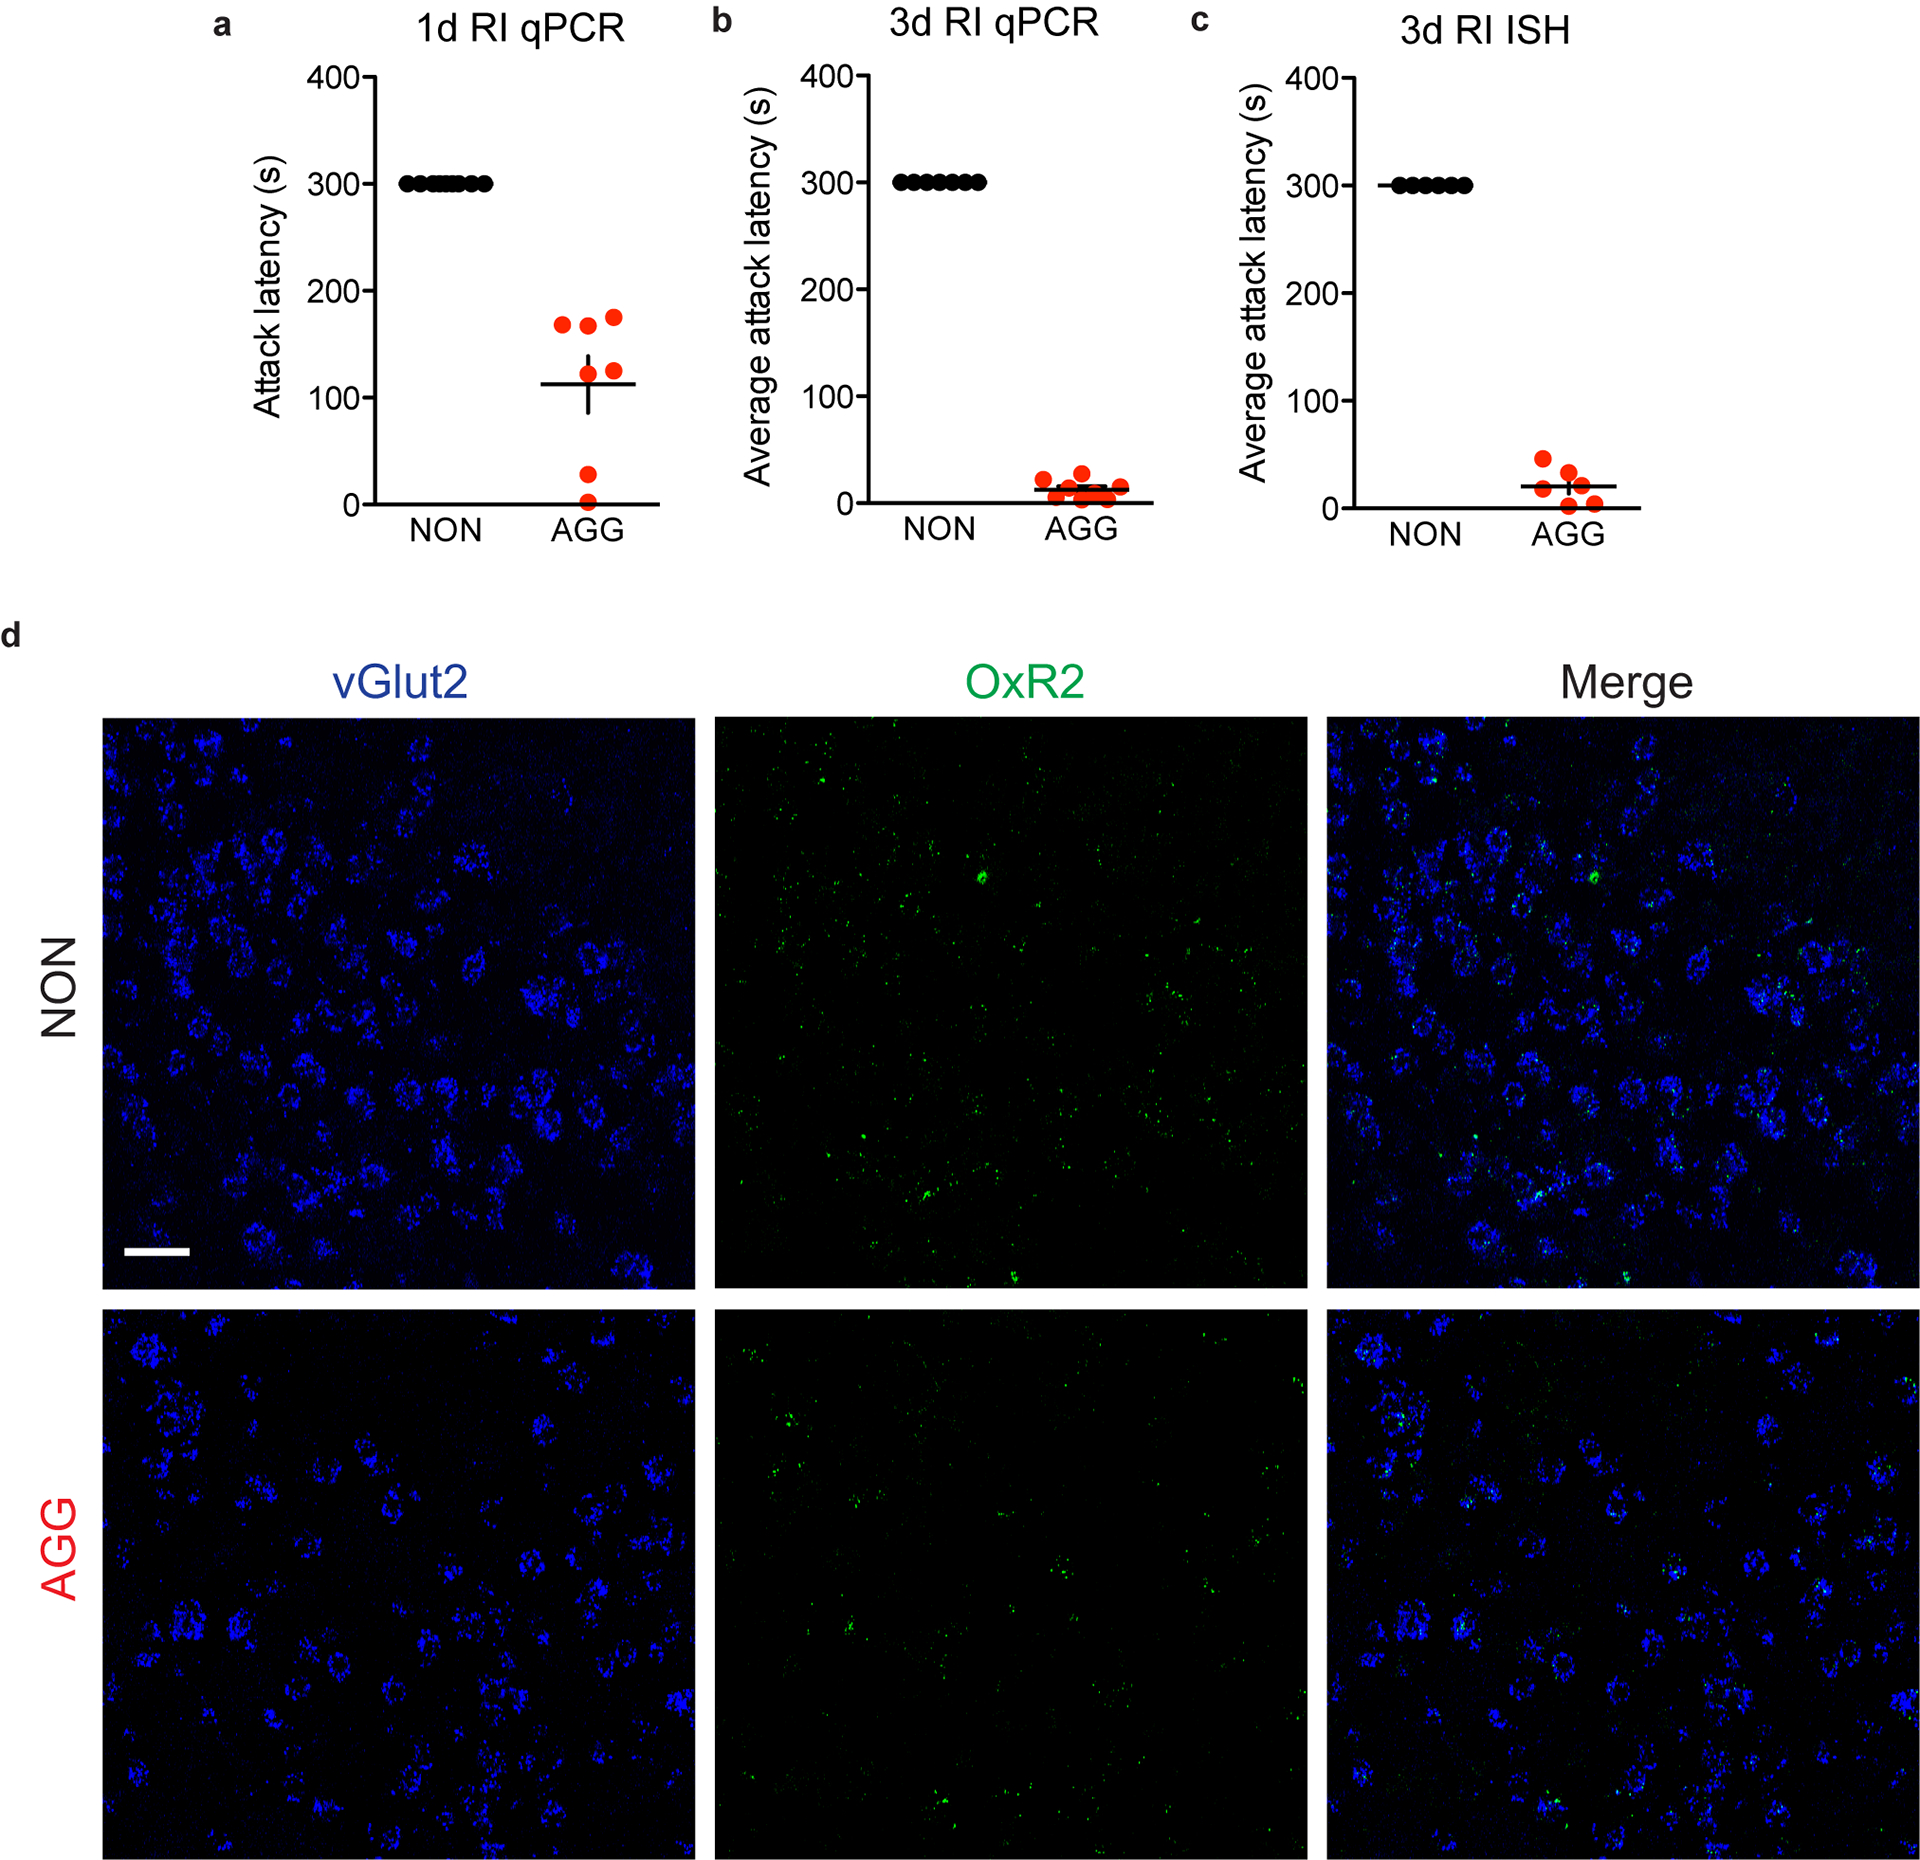
Extended Data Fig. 6. Attack latencies for AGGs and NONs used in qPCR and ISH experiments.

a, Attack latency for one day of RI in mice used for LHb qPCR, n=9 biologically independent NON mice, n=7 biologically independent AGG mice. b, Average attack latency for three days of RI in mice used for LHb qPCR, n=7 biologically independent NON mice, n=8 biologially independent AGG mice. c, Average attack latency for three days of RI in mice used for LHb OxR2 ISH, n=6 biologically independent NON mice, n=6 biologically independent AGG mice. d, Representative images from OxR2 ISH in AGG and NON LHb vGlut2 neurons following RI, accompanies Fig. 5j, scale bar = 20 μm. Notably, OxR2 expression was barely detectable in these neurons in AGGs or NONs, which is in line with our findings showing low OxR2 expression in vGlut2 neurons in Fig. 5b–c. Experimental images were taken from 12 biologically independent mice, 2 slices per mouse, with similar results obtained. All data are expressed as mean ± SEM.
