
Figure 3: Aggressive behaviors are associated with increased GAD2 LHb neuron activity.
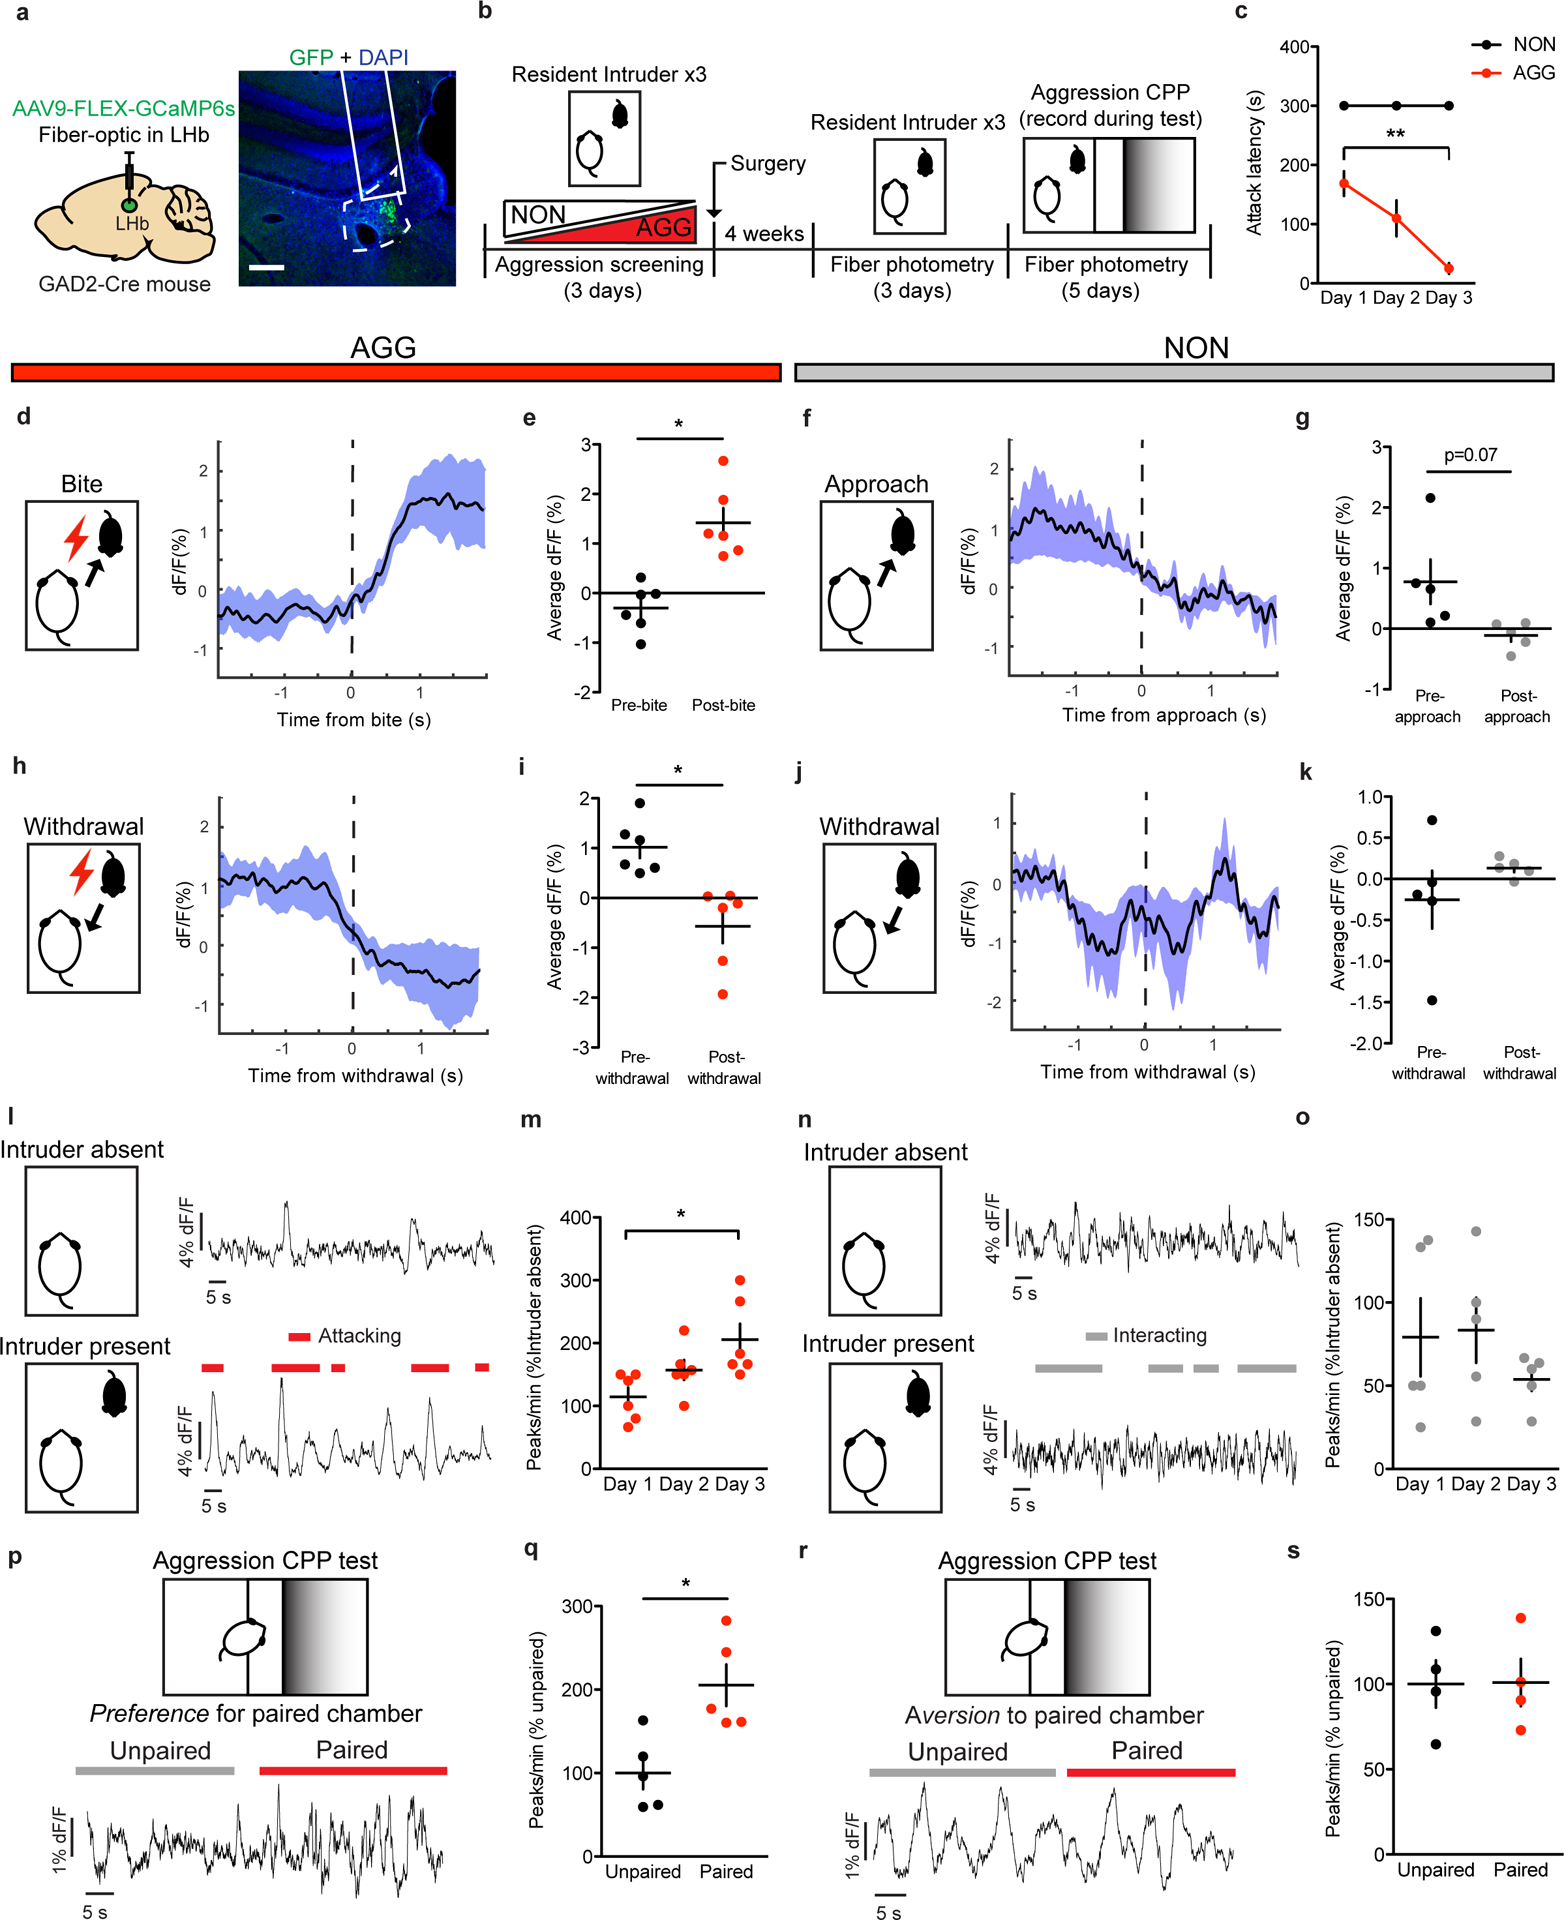
a, Surgical manipulations and representative viral infection for LHb GAD2 neuron photometry experiments, scale bar=400 μm. b, Experimental timeline for LHb GAD2 neuron photometry experiments. c, AGGs displayed reduced attack latency on day 3 of RI compared to day 1 of RI (one-way repeated measures ANOVA, n=5 biologically independent mice, F(2,10)=10.78, p=0.0032, main effect of day, Dunnett’s test for multiple comparisons, d1 vs d3 adjusted p=0.0018). d, Peri-event plot of AGG LHb GAD2 activity 2s before and after a bite on day 3 of RI. For all peri-event plots, black line denotes the mean signals for all animals, while blue shaded region denotes the SEM, n=5 biologically independent mice, 3–5 bites per mouse. e, AGGs displayed an increase in average GAD2 neuron activity following a bite (two-tailed paired t-test, n=5 biologically independent mice, 3–5 bites per mouse, t(5)=4.914, p=0.0044). f, Peri-event plot of NON LHb GAD2 neuron activity 2s before and after an intruder approach on day 3 of RI. Black line denotes mean signals for all animals, while blue shaded region denotes the SEM, n=5 biologically independent mice, 3–5 approaches per mouse. g, NONs displayed no change in average LHb activity following an approach (two-tailed paired t-test, n=5 mice, 3–5 approaches per mouse, t(4)=2.437, p=0.0714. h, Peri-event plot of AGG LHb GAD2 neuron activity 2s before and after a withdrawal from an aggressive bout. Black line denotes mean signals for all animals while blue shaded region denotes the SEM, n=6 biologically independent mice, 3–5 withdrawals per mouse. i, AGGs displayed a decrease in average LHb activity following a withdrawal (two-tailed paired t-test, n=6 mice, 3–5 withdrawals per mouse, t(5)=3.022, p=0.0294. j, Peri-event plot of NON LHb GAD2 neuron activity 2s before and after a withdrawal from a non-aggressive social interaction. Black line denotes mean signals for all animas while blue shaded region denotes the SEM, n=5 biologically independent mice, 3–5 withdrawals per mouse. k, NONs displayed no change in LHb GAD2 neuron activity after a withdrawal from a non-aggressive social interaction (two-tailed paired t-test, n=5 biologically independent mice, 3–5 withdrawals per mouse, t(4)=1.170, p=0.3068). l, Representative traces of AGG LHb GAD2 neuron activity in the absence and presence of an intruder mouse during day 3 of RI. m, AGGs displayed increased GAD2 LHb activity across three days of RI (one-way repeated measures ANOVA, n=6 biologically independent mice, F(2,10)=5.653, p=0.0228, Dunnett’s multiple comparisons test day 1 vs. day 3 adjusted p=0.0133) n, Representative traces of NON LHb GAD2 neuron activity in the absence and presence of an intruder mouse during day 3 of RI. o, NONs did not display changes in LHb GAD2 neuron activity across three days of RI (one-way repeated measures ANOVA, n=5 mice, F(2,14)=0.8904, p=0.4476). p, Representative trace of AGG LHb GAD2 neuron activity during the aggression CPP task. q, AGGs displayed increased LHb GAD2 neuron activity in the paired context compared to the unpaired context during the aggression CPP task (two-tailed paired t-test, t(4)=2.885, p=0.0448). r, Representative trace of NON LHb GAD2 neuron activity during the aggression CPP task. s, NONs did not display differences in LHb GAD2 neuron activity during the aggression CPP task (two-tailed paired t-test, t(3)=0.03591, p=0.9736). *p<0.05, **p<0.01. All data are expressed as mean ± SEM.