
Extended Data Fig. 2. LHB GAD2 neuron fiber phohometry supporting data.
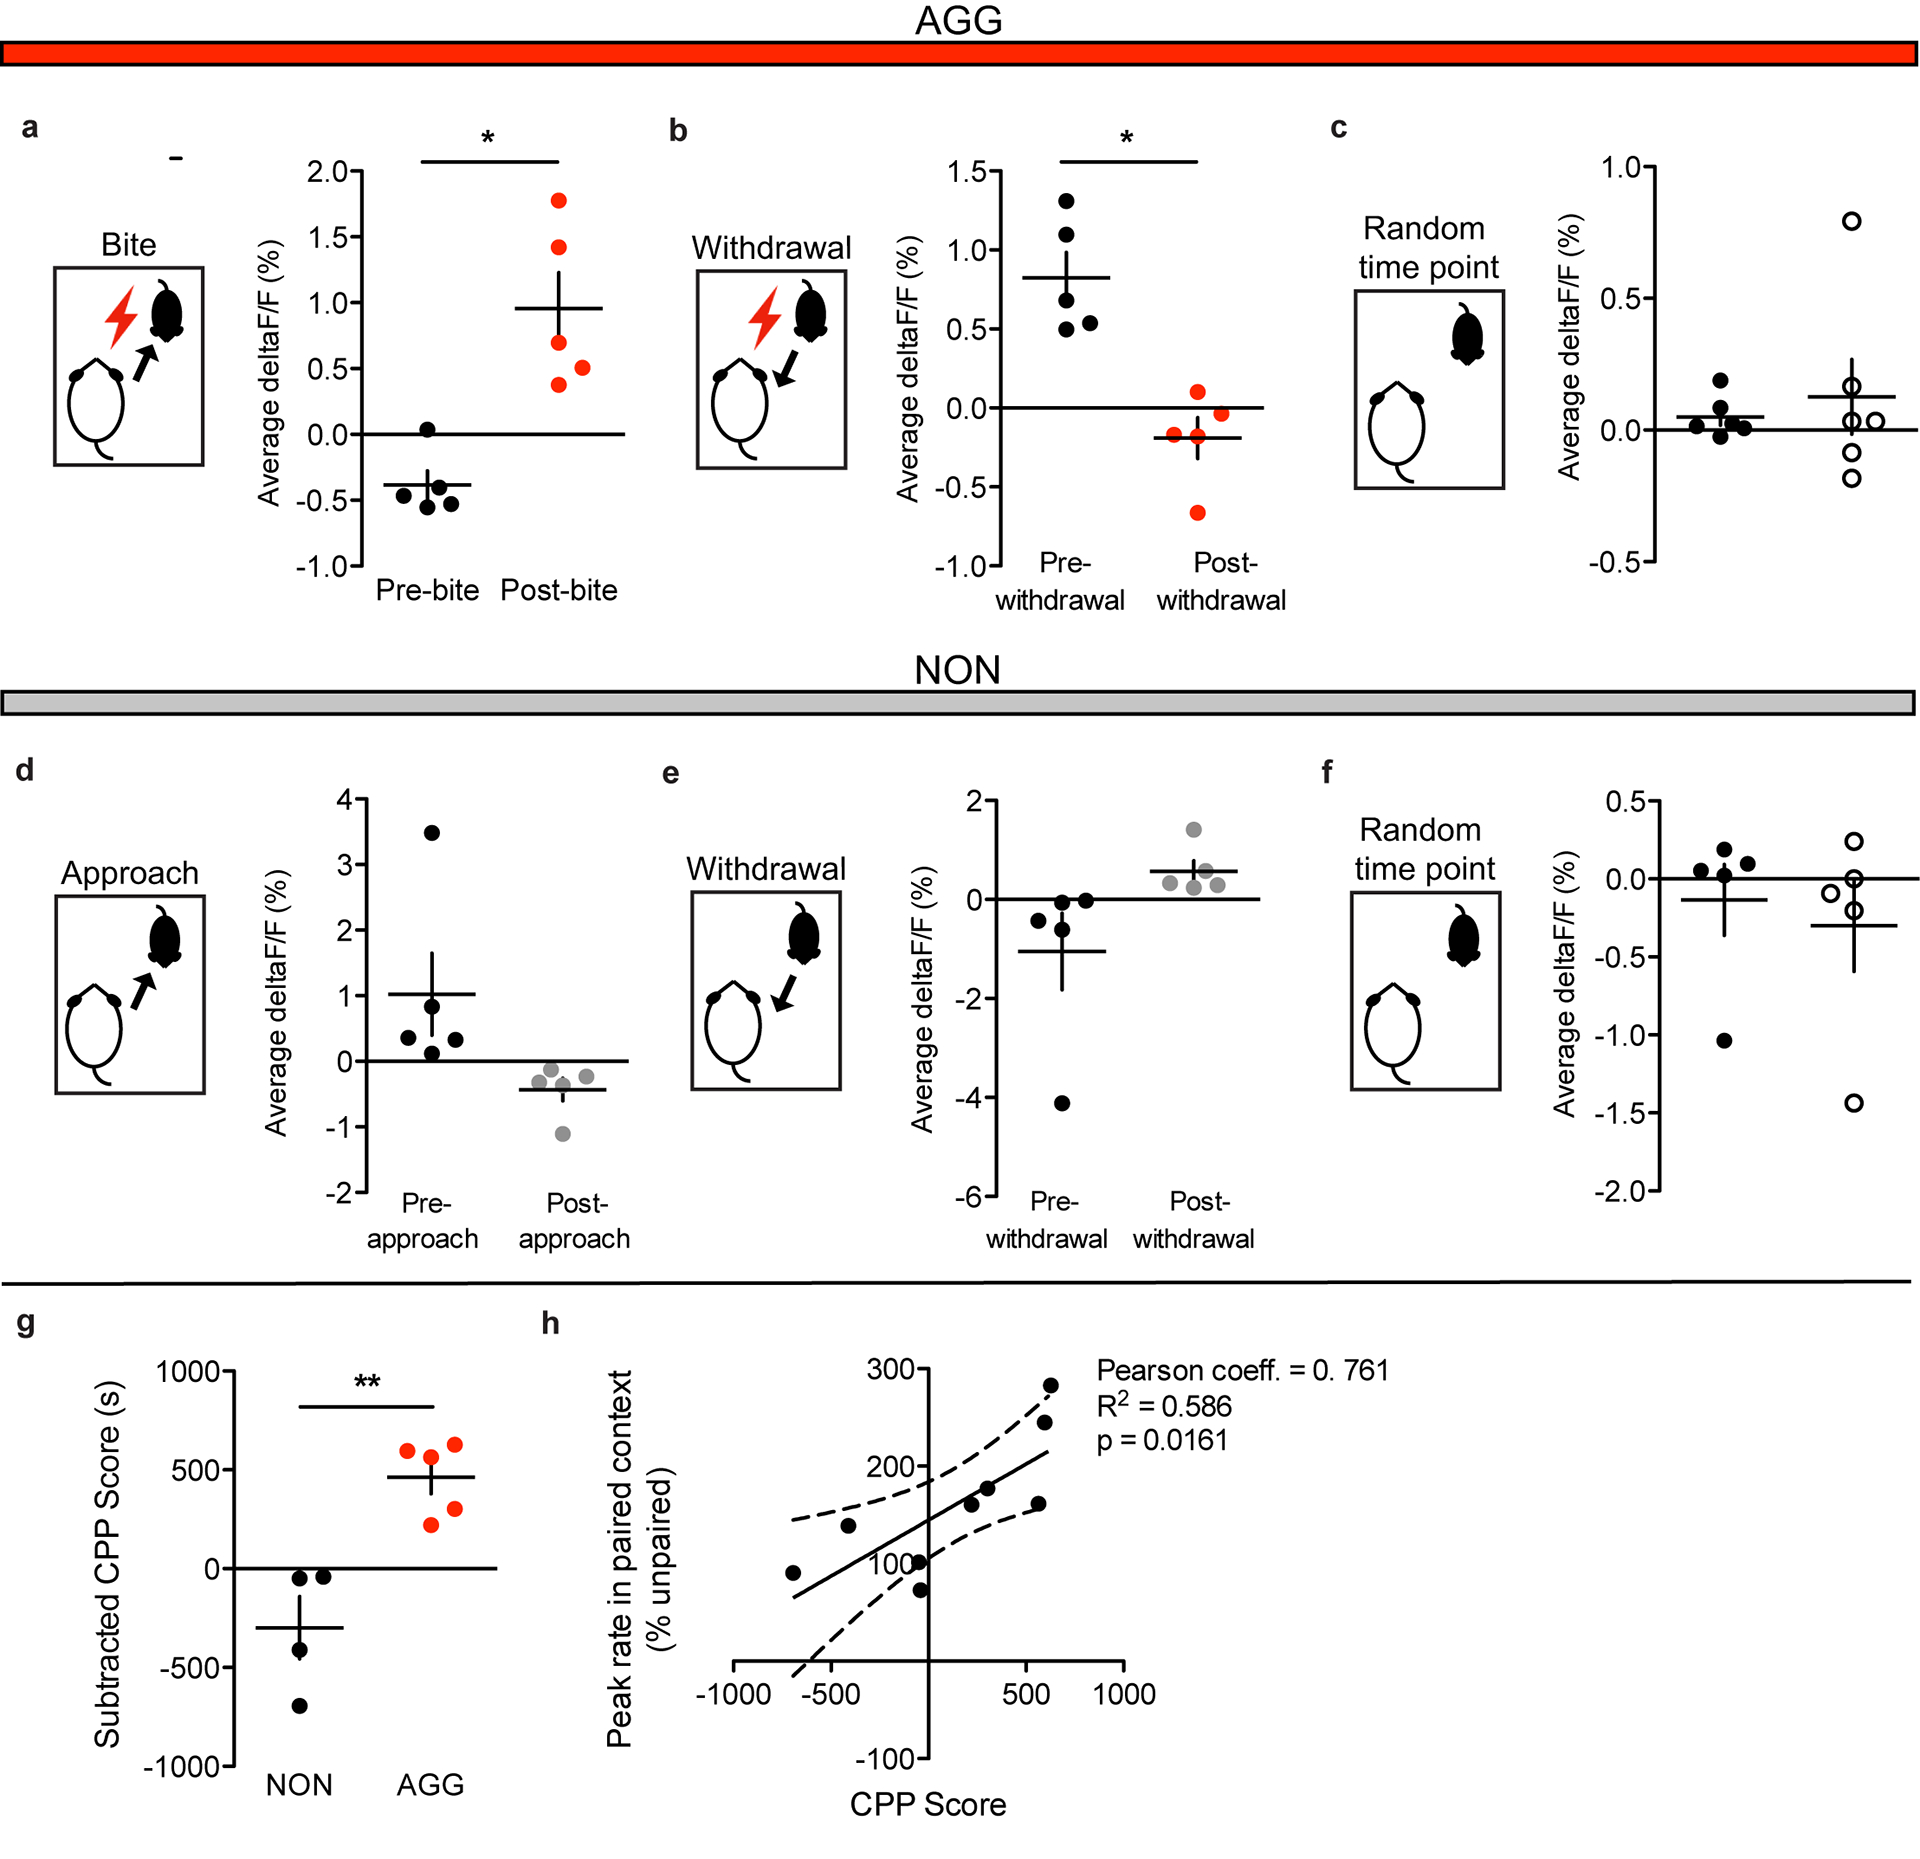
a, AGG LHb GAD2 neuron activity was increased following bites on day 1 of RI (two-tailed paired t-test, n=5 biologically independent mice, 2–5 bites per mouse, t(4)=4.008, p=0.016). b, AGG LHb GAD2 neuron activity was reduced following a withdrawal from an aggressive encounter on day 1 of RI (two-tailed paired t-test, n=5 biologically independent mice, 3–5 withdrawals per mouse, t(4)=3.982, p=0.0164). c, AGG LHb GAD2 neuron activity did not differ before and after random times points on day 3 of RI (two-tailed paired t-test, n=5 biologically independent mice, 5 time points per mouse, t(4)=0.493, p=0.6475). d, NON LHb GAD2 neuron activity was not different before and after an approach on day 1 of RI (two-tailed paired t-test, n=5 biologically independent mice, 3–5 approaches per mouse, t(4)=1.843, p=0.1406). e, NON LHb GAD2 neuron activity was not different before and after a withdrawal from a non-aggressive social interaction on day 1 of RI (two-tailed paired t-test, n=5 biologically independent mice, 3–5 withdrawals per mouse, t(4)-1.633, p=0.1777). f, NON LHb GAD2 neuron activity did not differ before and after random time points on day 3 of RI (two-tailed paired t-test, n=5 biologically independent mice, t(4)=1.721, p=0.1634). g, GAD2-cre AGGs used for fiber photometry experiments displayed significantly higher aggression CPP scores than GAD2-cre NONs (two-tailed paired t-test, n=5 biologically independent mice, t(4)=2.885, p=0.0448). h, LHb GAD2 neurons peaks in the intruder paired context during the CPP preference test were positively correlated with CPP score (two-tailed student’s t-test,A n=10 biologically independent mice, Pearson correlation coefficient = 0.761m, R2=0.586, p=0.0161). *p<0.05, **p<0.01. *p<0.05. All data are expressed as mean ± SEM.