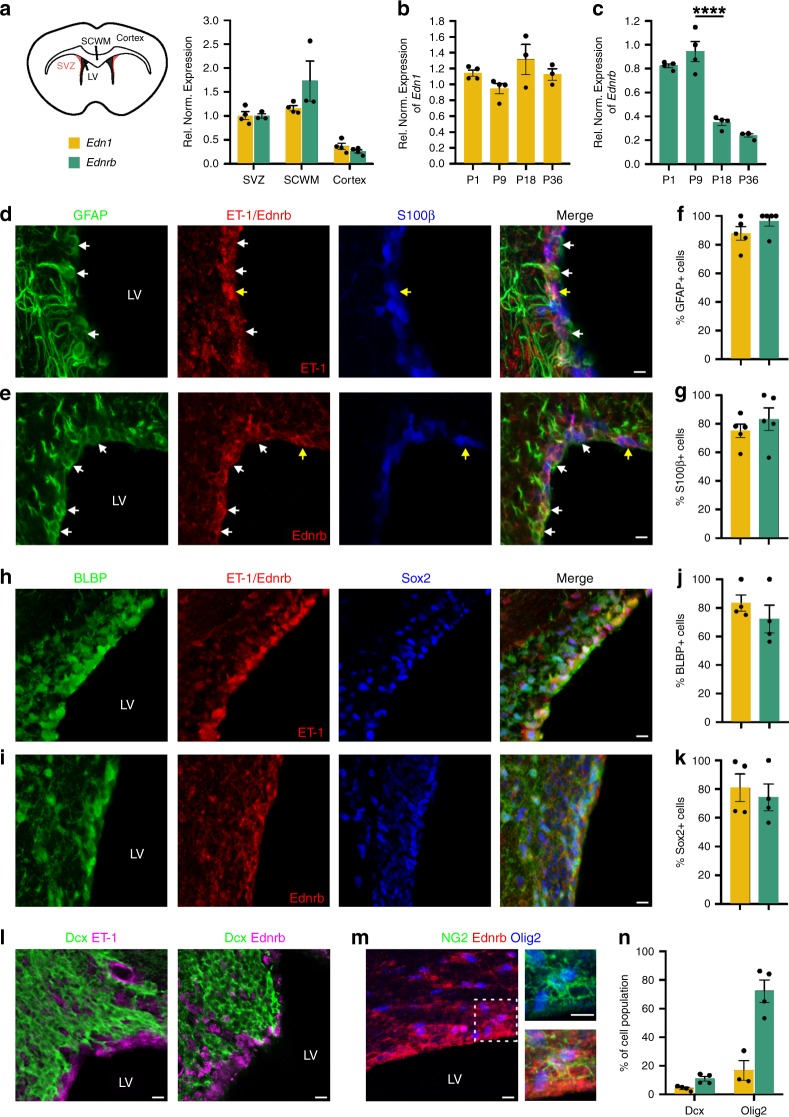
Fig. 1. ET-1 and Ednrb are expressed in the developing postnatal SVZ.
a QPCR for Edn1 and Ednrb mRNA levels in different regions of the postnatal day 7 (P7) mouse brain. SCWM and cortex values were compared with SVZ expression values, which were normalized to 1. (Edn1: n = 4 mice for each region, Ednrb: n = 3 mice for SVZ and SCWM, 4 mice for Cortex). QPCR for Edn1 (b) and Ednrb (c) mRNA levels in the SVZ over the first postnatal month (n = 4 mice for each timepoint, except n = 3 for Edn1 P18 and P36 timepoints). ****p value < 0.0001 (one-way ANOVA with Tukey’s multiple comparisons test). P1, P18, and P36 values were compared with P9 expression values, which were normalized to 1. Both ET-1 (d) and Ednrb (e) protein co-localize with RGC markers GFAP and S100β in the P10 mouse SVZ. White arrows point to ET-1+ or Ednrb+ GFAP+ cells. Yellow arrows point to ET-1+ or Ednrb+ S100β+ cells. Quantification of the percentage of GFAP+ cells (f) and S100β+ cells (g) in the dorsal WT SVZ at P10 that express ET-1 (yellow bar) or Ednrb (teal bar). (n = 5 WT mice for ET-1 and Ednrb). Both ET-1 (h) and Ednrb (i) protein co-localized with RGC markers BLBP and Sox2. Quantification of the percentage of BLBP+ cells (j) and Sox2+ cells (k) in the dorsal WT SVZ at P10 that express ET-1 or Ednrb. (n = 4 WT mice for ET-1 and Ednrb). l Neither ET-1 nor Ednrb is expressed by Dcx+ NPCs. m NG2+ Olig2+ OPCs in the SVZ and SCWM express Ednrb. n Quantification of the percentage of Dcx+ cells and Olig2+ cells in the dorsal SVZ that express ET-1 or Ednrb at P10. (n = 4 WT mice for ET-1 and Ednrb co-staining with Dcx, 3 WT mice for ET-1 co-staining with Olig2, and 4 WT mice for Ednrb co-staining with Olig2). All scale bars = 10 μm. LV lateral ventricle. Data are presented as mean values ± SEM. Source data are provided as a Source Data file.

