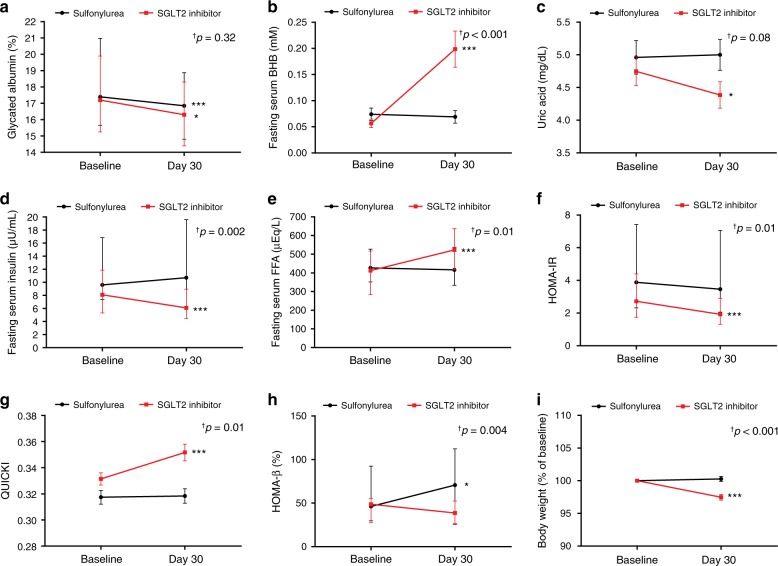
Fig. 2. Effects of SGLT2 inhibitor and sulfonylurea on metabolic parameters.
a–i Changes in metabolic parameters from baseline to end of treatment (sulfonylurea group: n = 32, SGLT2 inhibitor group: n = 29). †Statistical significance for the time × group interaction evaluated by repeat-measures analysis of variance (ANOVA) (Non-normally distributed variables were log transformed for analysis and back transformed for presentation). Data are represented as mean ± SEM or median (interquartile range). Two-sided paired t test or Wilcoxon signed rank test; *P < 0.05, **P < 0.01, and ***P < 0.001 versus baseline. BHB β-hydroxybutyrate, FFA free fatty acid, HOMA-IR homeostatic model assessment of insulin resistance, QUICKI quantitative insulin sensitivity check index, SEM standard error of the mean, SGLT2 sodium–glucose cotransporter 2. Source data are provided as a Source Data file.

