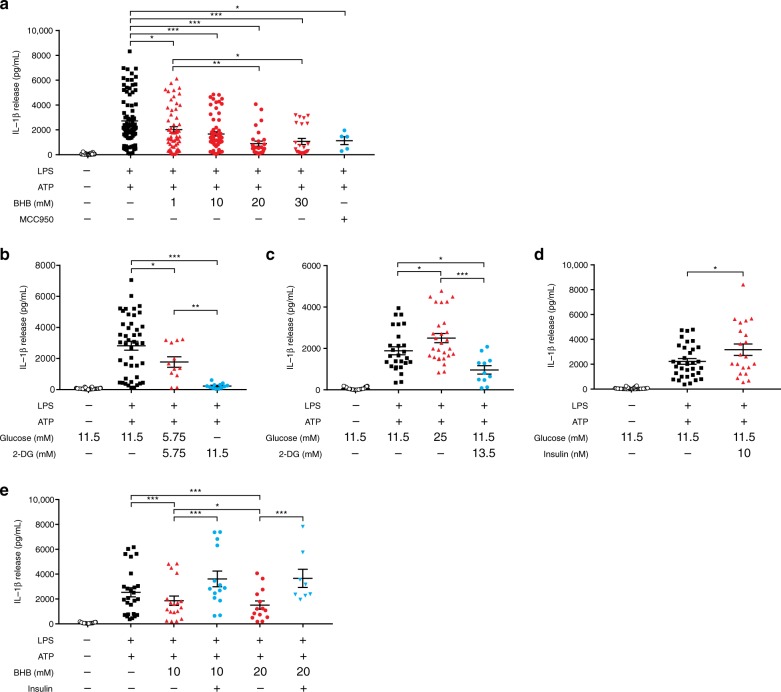
Fig. 4. Effects of BHB, glucose, and insulin on NLRP3 inflammasome activation in human macrophages by ELISA assay.
IL-1β secretion when exposed to vehicle or 2 mM ATP with 0.1 μg/mL LPS priming and increased BHB (1, 10, 20, and 30 mM) or 100 nM MCC950, a small-molecule inhibitor of NLRP3 inflammasome (administered for the last 5 hours as a positive control) (a); increased 2-DG (b); increased glucose (11.5 mM vs. 25 mM) (c); 11.5 mM glucose with/without 10 nM insulin (d); increased BHB (10 mM vs. 20 mM) with/without 10 nM insulin (e). 5–64 biologically independent samples per treatment; experiments on each treatment were repeated up to three times per sample. Symbols are data points from independent experiments: n = 137, 90, 58, 64, 28, 24, 5 (a, left to right), 66, 44, 12, 12 (b, left to right), 39, 27, 28, 11 (c, left to right), 48, 33, 21 (d, left to right), 39, 26, 18, 14, 14, 8 (e, left to right). Data are represented as mean ± SEM. One-way analysis of variance (ANOVA) using Tukey’s test or a two-tailed Student’s t test with the Bonferroni method for adjusting P values; *P < 0.05, **P < 0.01, and ***P < 0.001. BHB β-hydroxybutyrate, IL-1β interleukin-1β, NLRP3 NLR family, pyrin domain-containing 3, SEM standard error of the mean, 2-DG 2-deoxyglucose. Source data are provided as a Source Data file.

