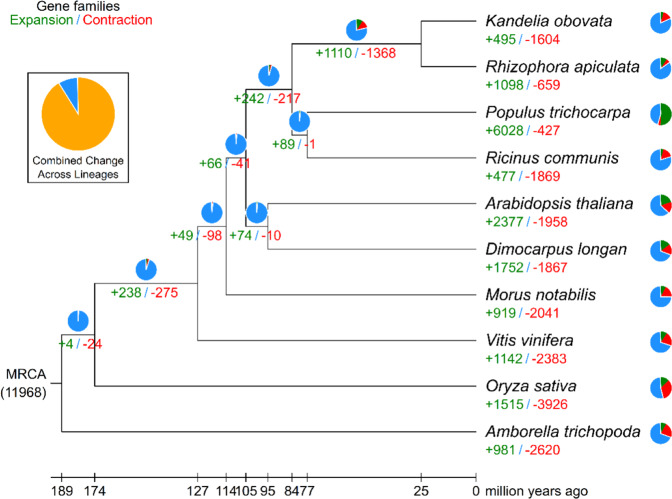
Fig. 3. The expansion and contraction of gene families.
The green number indicates the number of expanded gene families, and the red number indicates the number of contracted gene families. The blue color in the circle shows the gene families whose copy numbers are constant, while the orange color represents the proportion of 11,968 gene families in the most recent common ancestor that have expanded or contracted during late differentiation

