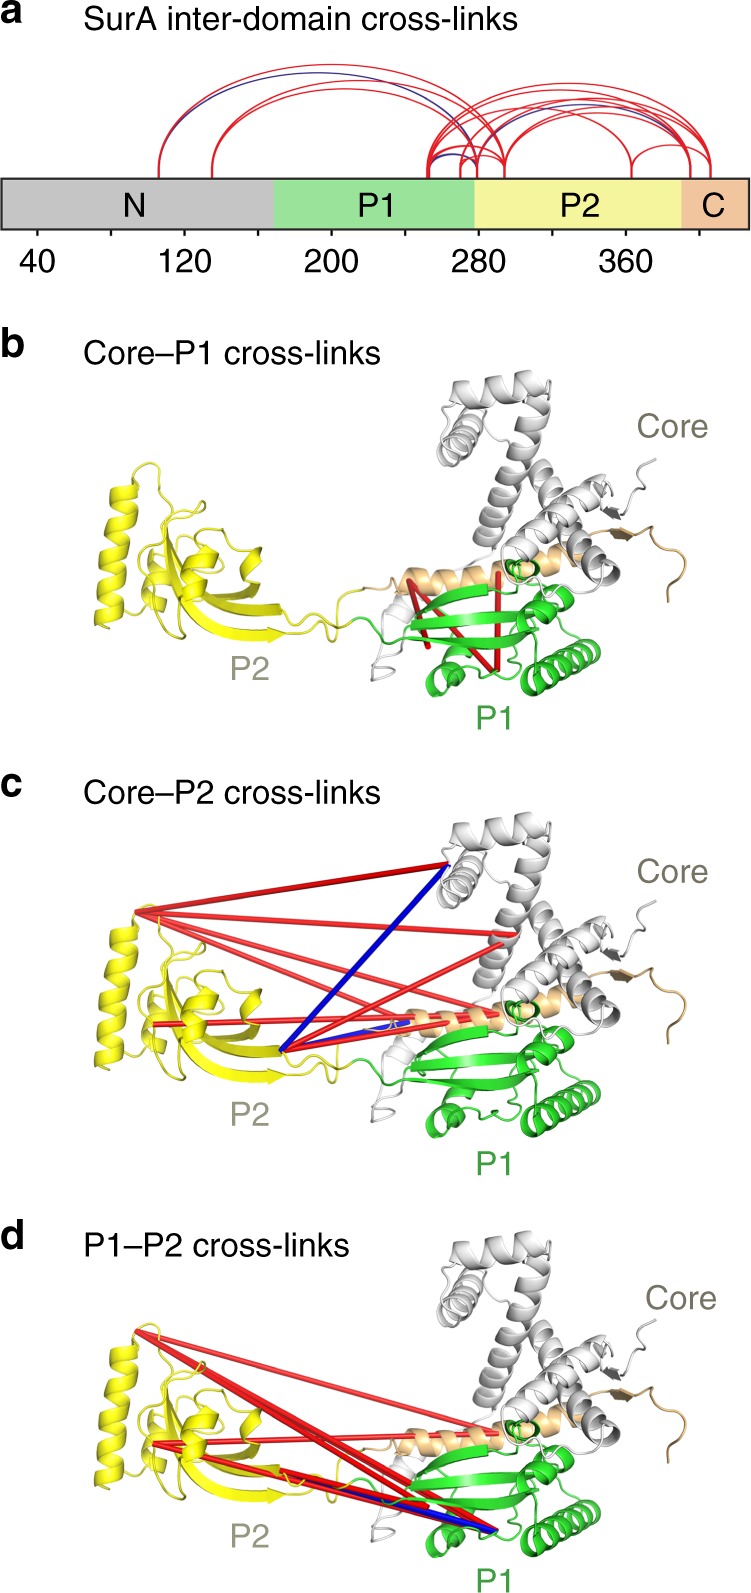
Fig. 2. XL-MS suggests the P2 domain is closer to the core/P1 than implied by the crystal structure.

a Locations of the 19 identified SurA inter-domain cross-links (red and blue lines). b–d Crystal structure of SurA showing the identified inter-domain cross-links between b core-P1 (3 in total), c core-P2 (9 in total), and d P1-P2 (7 in total). Only four of the inter-domain cross-links identified (coloured in blue) are consistent with the crystal structure of full-length SurA (PDB 1M5Y27), based on a maximum SASD of 35 Å35. Other cross-links are inconsistent with this distance cut-off (red lines). Details of cross-linked residues are given in Supplementary Table 1. A representative mass spectrum for each cross-link can be found in Supplementary Data 1. Reactions contained 5 µM SurA, 50 µM DSBU, in 10 mM potassium phosphate buffer, pH 8.0, for 45 min, 25 °C. Note that for clarity cross-links are shown as straight lines between residues (rather than as SASDs which provide a more reliable measurement for comparison with protein structures (see text)). The N-terminal region of the core domain, P1, P2 and the C-terminal region of the core domain are shown in grey, green, yellow and orange, respectively.
