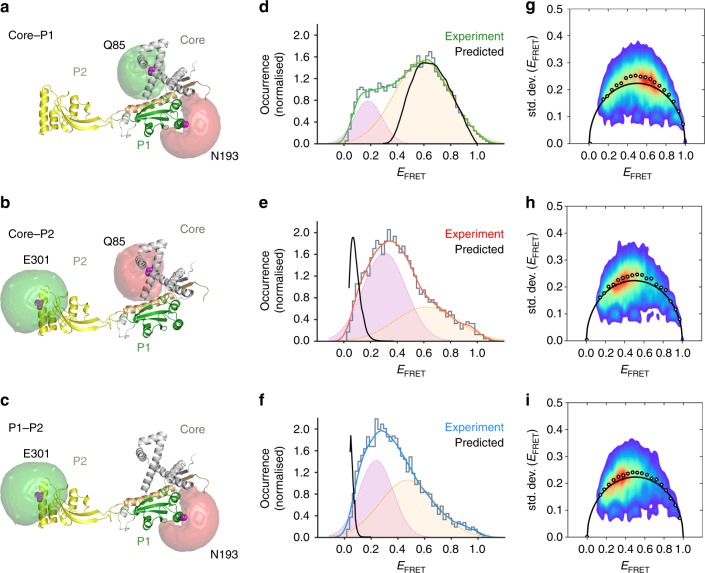
Fig. 3. Comparison of smFRET data to values predicted from crystal structure of SurA.
The crystal structure of SurA indicating the available volumes calculated for each dye label at residues a 85 and 193 (core-P1 distance probes); b 85 and 301 (core-P2 distance probes) and c 193 and 301 (P1-P2 distance probes). d–f Predicted EFRET between each pair of dyes for the crystal structure of SurA (black line) and the observed EFRET distributions (green, red or blue lines) independently fitted to two Gaussians (pink/yellow). g–i BVA reveals high variance for all three dye pairs. The average values of the measured variance for the EFRET values (white filled circles) lie above the expected shot-noise limited standard deviation (black arc) indicating dynamics on a timescale faster than the duration of the bursts (here sub-ms). Predicted EFRET distributions d–f were calculated from the SurA crystal structure (PDB 1M5Y27) using distance distributions generated by the MtsslWizard plugin for PyMOL103, which takes into account both the location of the dyes and the flexibility of the dye linkers39. Note that all dyes can be considered as freely rotating, as manifested by their low anisotropy (Supplementary Table 2), hence changes in EFRET can be translated to distance variations. Samples contained ~50 pM labelled SurA variant in 50 mM Tris-HCl, pH 8.0, 25 °C.

