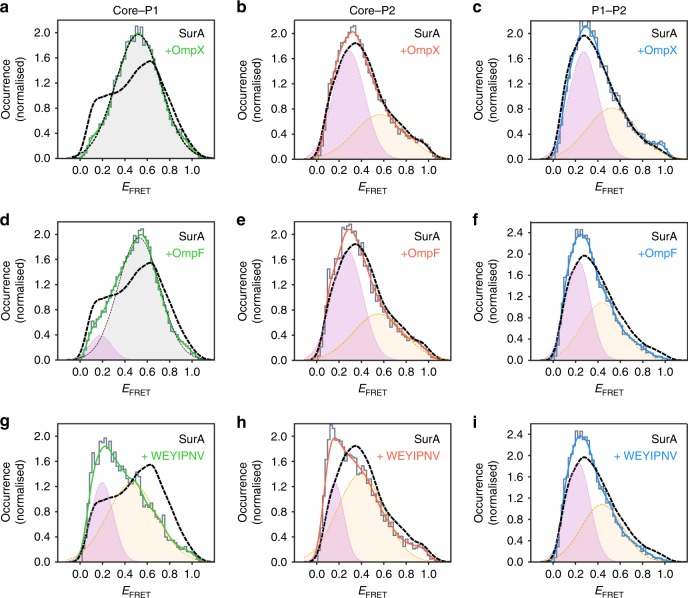
Fig. 7. Response of SurA inter-domain distances to substrate binding measured by smFRET.
Experimentally measured EFRET distributions (grey) at equilibrium for the three pairwise combinations of fluorescently-labelled SurA double mutants (core-P1, core-P2, and P1-P2) in the presence of a–c OmpX, d–f OmpF, or g–i WEYIPNV. Kernel density estimations (KDEs) of the probability density function of the measured EFRET values are shown as green, red and blue solid lines for a, d, g SurA core-P1, b, e, h core-P2 and c, f, i P1-P2 pairwise measurements in the presence of OmpX, OmpF or peptide WEYIPNV, respectively. Each were fitted to a maximum of two Gaussians to appraise the ensemble heterogeneity (note that these do not necessarily represent true discrete states). Only a single Gaussian was used in (a) as this distribution is approximately unimodal. The corresponding apo-SurA distributions (black dashed lines, taken from Fig. 3d–f) are shown for reference to allow comparison between apo and holo SurA. Samples contained ~50 pM labelled SurA variant, 1.5 μM OmpX/OmpF/WEYIPNV, in 50 mM Tris-HCl, pH 8.0, 25 °C, with a final urea concentration of 0.24 M in the OMP-containing samples.

