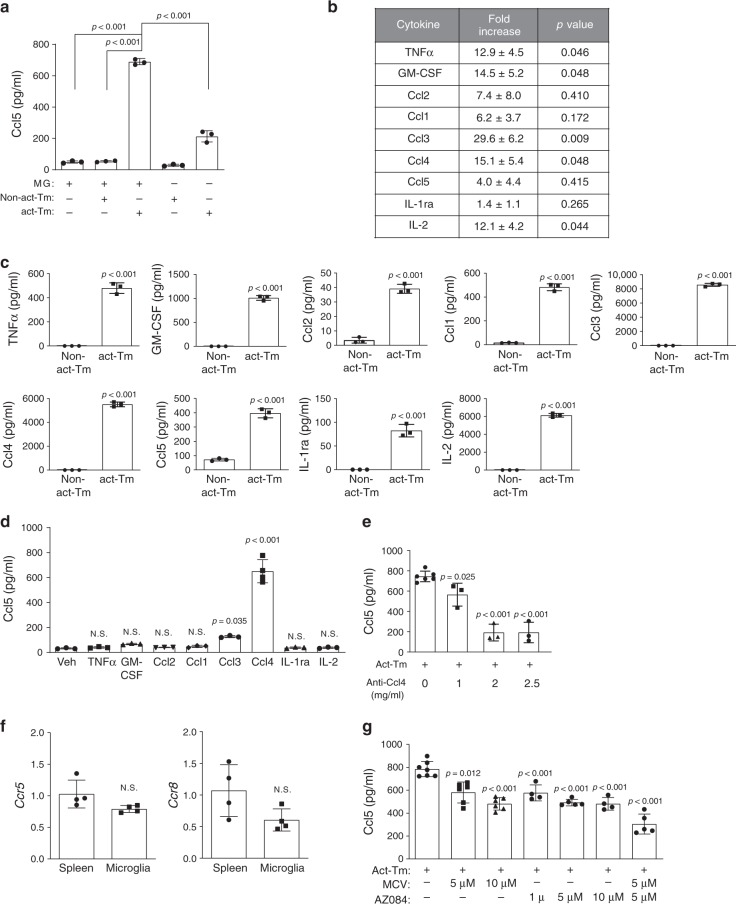
Fig. 1. Activated T cells secrete Ccl4 and prime microglia to produce Ccl5.
a Activated T cell conditioned medium (act-Tm CM) treatment stimulated WT microglia (MG) to produce a higher level of Ccl5 (ELISA) compared to non-activated T cell-conditioned medium (non-act-Tm CM). Non-activated and activated T cell CM, and CM collected from microglia alone served as controls for these experiments. b WT T cells isolated from the mouse spleen were seeded at the concentration of 2.5 × 10⁶ cells ml−1 in complete PRIM1640 medium followed by 2 days of CD3/CD28 stimulation (activated; act-Tm) or vehicle (PBS) treatment (non-activated; non-act-Tm). CM was collected for chemokine array triplicates. Increased levels of TNF-α, GM-CSF, Ccl2, Ccl1, Ccl3, Ccl4, Ccl5, Il-1ra, and Il-2 expression were observed in activated T cell CM relative to non-activated T cell CM. The fold increases and P values relative to control groups for all three replicates (Supplementary Fig. 1a) are collated in the table. c ELISA assays reveal increased levels of TNFα, GM-CSF, Ccl2, Ccl1, Ccl3, Ccl4, Ccl5, Il-1ra, and Il-2 in the CM of activated, relative to non-activated, T cells. d WT microglia were stimulated with these differentially expressed cytokines [TNF-α (400 pg ml−1), GM-CSF (1000 pg ml−1), Ccl2 (80 pg ml−1), Ccl1 (500 pg ml−1), Ccl3 (8000 pg ml−1), Ccl4 (6000 pg ml−1), Il-1ra (80 pg ml−1), and Il-2 (6000 pg ml−1)] for 24 h at the concentrations detected in the activated T cell CM. Ccl5 production by microglia was increased following Ccl4 (6000 pg ml−1) treatment. Veh: vehicle. e Ccl5 ELISA revealed that activated T cell CM induction of microglial Ccl5 production was reduced following treatment with increasing concentrations of Ccl4 neutralizing antibody. f Microglial Ccr5 and Ccr8 expression was validated using spleen as a positive control. g Increasing concentrations of maraviroc (MCV, Ccr5 receptor inhibitor) and AZ084 (Ccr8 receptor inhibitor) reduced T cell induction of microglial Ccl5 expression. The combination of MCV and AZ084 exhibited the greatest inhibition of microglial Ccl5 expression. All data are presented as the mean ± SEM. a This representative experiment was conducted with n = 3 independent biological samples, and was replicated two additional times with similar results. b n = 3 independent biological samples were examined over three independent experiments, as illustrated in Fig. S1a. c and d Bar graphs represent the means ± SEM of n = 3 independent biological samples. e This representative experiment was conducted with 0 mg ml−1 anti-Ccl4, n = 6; 1, 2, 2.5 mg ml−1 anti-Ccl4, n = 3, independent biological samples, and was replicated two additional times with similar results. f Bar graphs represent the means ± SEM of n = 4 independent biological samples. g This representative experiment was conducted with (from left to right) n = 7, n = 6, n = 6, n = 4, n = 5, n = 4, and n = 5 independent biological samples, and was replicated two additional times with similar results. a, d, e, g One-way ANOVA with Bonferroni post-test correction; b, c, f Two-tailed Student’s t-test. Exact P values are indicated within each panel; N.S.; not significant. From left to right in each panel: a all P < 0.001, c all P < 0.001, d N.S., N.S., N.S., N.S., P = 0.035, P < 0.001, N.S., N.S.; e P = 0.025, P < 0.001, P < 0.001; f N.S.; g P = 0.012, P < 0.001, P < 0.001, P < 0.001, P < 0.001, P < 0.001.

