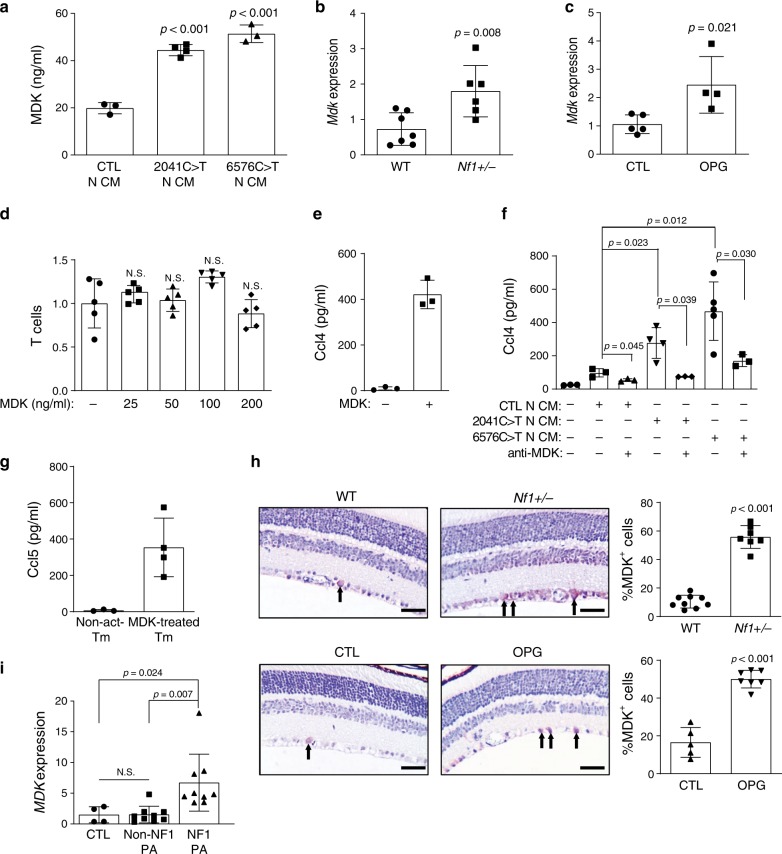
Fig. 2. NF1-mutant neurons express MDK, which activates T cells to produce Ccl4.
a Isogenic hiPSC-induced neurons with heterozygous NF1 patient NF1 gene mutations (2041C>T and 6576C>T) produced higher levels of midkine in the neuron conditioned medium (N-CM) compared to WT (CTL) hiPSC-induced neurons. b Mdk gene expression was higher in the optic nerves of Nf1+/− relative to WT mice. c Increased Mdk expression was observed in optic glioma (OPG)-containing relative to control (CTL) optic nerves. d No change in T cell migration was observed in response to various MDK concentrations. e MDK (50 ng ml−1) stimulation for 48 h increased T cell Ccl4 production. f CM from isogenic hiPSC-induced neurons with NF1 patient NF1 gene mutations (c.2041C>T-N-CM and c.6576C>T-N-CM) exhibited a stronger T cell Ccl4 induction compared to CM from control hiPSC-induced neurons (CTL-N-CM). Anti-MDK neutralizing antibodies reduced T cell Ccl4 production in response to hiPSC-induced neuron CM stimulation. g MDK-activated (50 ng ml−1) T cell CM (mid-treated Tm) increased microglial Ccl5 production relative to non-activated T cell CM (non-act-Tm). h Immunohistochemistry revealed an increased percentage of MDK-immunoreactive cells in the retinal ganglion cell layer of OPG-bearing and Nf1+/− mice relative to control (CTL) or WT mice, respectively. Scale bars, 40 µm. Arrows denote representative immunopositive cells. i MDK gene expression was examined in NF1 pilocytic astrocytomas (NF1-PAs, n = 9), non-NF1-PAs (n = 9), and non-neoplastic brain tissues (n = 4). Increased MDK expression was detected in NF1-PAs compared to normal brain tissue and non-NF1-PAs. Arrows denote representative immunopositive cells. All data are presented as the mean ± SEM. a–c These representative experiments were conducted with a CTL, n = 3, 2041C>T n = 4, 6576C>T, n = 3; b WT, n = 7, Nf1±, n = 6; c CTL, n = 5, OPG, n = 4, independent biological samples, and were replicated two additional times with similar results. d and e Bar graphs represent the means ± SEM of d n = 5, e n = 3, independent biological samples. f This representative experiment was conducted with (from left to right) n = 3, n = 3, n = 3, n = 4, n = 3, n = 5, and n = 3 independent biological samples, and were replicated two additional times with similar results. g Bar graphs represent the means ± SEM of non-activated Tm, n = 3; MDK-treated Tm, n = 4 independent biological samples. h Bar graphs represent the means ± SEM of WT n = 9, Nf1+/−, n = 7, CTL, n = 5, OPG, n = 7, independent biological samples. i Bar graphs represent the means ± SEM of CTL, n = 4, non-NF1, PA, n = 9, NF1, PA, n = 9, independent biological samples. a, d, f, i One-way ANOVA with Bonferroni post-test correction, b, c, h Two-tailed Student’s t-test. Exact P values are indicated within each panel; N.S.; not significant. From left to right in each panel: a all P < 0.00, 1 b P = 0.008, c P = 0.021, d all N.S.; f top P = 0.012, middle P = 0.023, P = 0.030, bottom P = 0.045, P = 0.039; i CTL:NF1 PA P = 0.024, non-NF1 PA:NF1-PA P = 0.007; h all P < 0.001.

