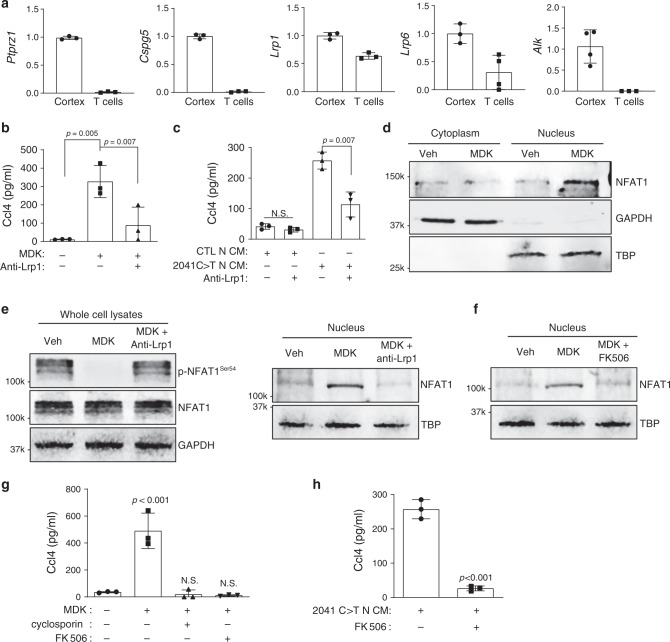
Fig. 3. MDK activates T cells to produce Ccl4 through Lrp1/calcineurin/NFAT1 signaling.
a T cells expressed only two (Lrp1 and Lrp6) of the putative MDK receptors [protein-tyrosine phosphatase ζ (Ptprz1), neuroglycan-C (Cspg5), low density-lipoprotein receptor-related protein-1 (Lrp1), low density-lipoprotein receptor-related protein-6 (Lrp6) and anaplastic lymphoma kinase (Alk)] by quantitative RT-PCR. Normal mouse cortex was used as an internal positive control. b Lrp1 blocking antibodies (30 µg ml−1) reduced MDK-induced Ccl4 production in T cells. c The 2041C>T neuron conditioned media (N-CM)-mediated Ccl4 production in T cells was attenuated following exposure to Lrp1 receptor blocking antibodies. d Immunoblotting revealed increased NFAT1 nuclear localization in T cells following MDK treatment. Glyceraldehyde 3-phosphate dehydrogenase (GAPDH) and TATA-binding protein (TBP) served as loading controls for the cytoplasm and nuclear fractions, respectively. e Decreased levels of phosphorylated-NFAT1 (p-NFAT) were observed after MDK stimulation of T cells. Lrp1 blocking antibodies (anti-Lrp1, 30 µg ml−1) increased NFAT1 phosphorylation and impaired NFAT1 nuclear localization in MDK-stimulated T cells. f The calcineurin inhibitor FK506 (10 μM) inhibited MDK-induced NFAT1 nuclear localization. g Calcineurin inhibitors, cyclosporin (100 nM) and FK506 (10 μM), inhibited MDK-induced Ccl4 production in T cells. h FK506 (10 μM) reduced 2041C>T neuron conditioned media (N-CM)-induced Ccl4 production in T cells. All data are presented as the mean ± SEM. a Bar graphs represent the means ± SEM of n = 3 independent biological samples. b, c; g, h These representative experiments were conducted with n = 3 independent biological samples,and were replicated two additional times with similar results. b, c, g One-way ANOVA with Bonferroni post-test correction, h Two-tailed Student’s t-test. Exact P values are indicated within each panel; N.S.; not significant. From left to right in each panel: b P = 0.005, P = 0.007; c N.S., P = 0.007; g P < 0.001, N.S., N.S.; h P < 0.001. d–f These are representative images of n = 3 independent biological samples examined over three independent experiments with similar results. Molecular weight markers are denoted at the left side of each blot.

