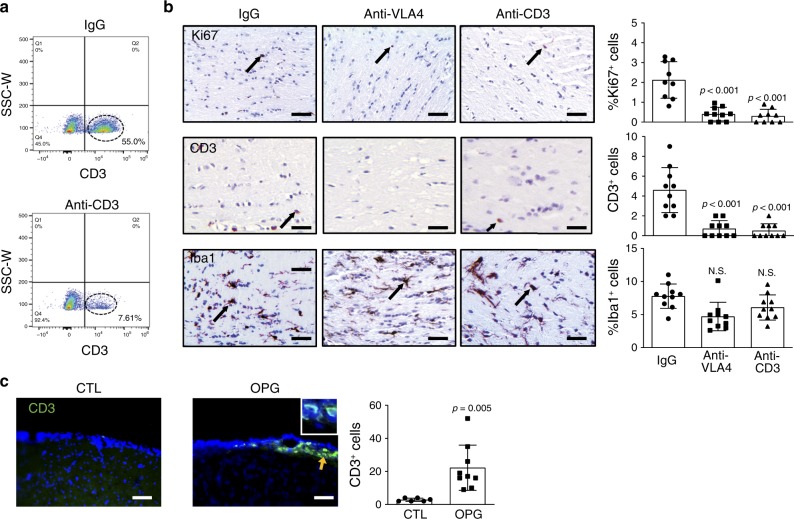
Fig. 4. Nf1 optic glioma mice exhibit increased meningeal and parenchymal T cells.
a CD3+ T cells (circled with dash line) were depleted in splenocytes from anti-CD3 antibody-treated mice (7.6%) relative to IgG-treated mice (55%), as measured by flow cytometry. b Immunohistochemistry revealed that anti-VLA4 and anti-CD3, but not control IgG, antibody treatments reduced CD3+ T cell infiltration and the percentage of Ki67+ cells in murine Nf1 optic gliomas. No differences in microglia content (%Iba1+ cells) were observed in the anti-VLA4 and anti-CD3 groups compared to the IgG controls. Arrows denote representative immunopositive cells. Black arrows indicate representative immunopositive cells. c Immunofluorescence microscopy revealed increased meningeal CD3+ lymphocyte infiltration in optic glioma (OPG)-bearing mice, relative to the control (CTL) mice. Yellow arrow denotes representative immunopositive cells. DAPI (blue) is used as a nuclear counter stain. a, c Scale bars, 40 µm. b Bar graphs represent the means ± SEM of (top panel) IgG, n = 9; anti-VLA4, n = 10; anti-CD3, n = 9; (middle and bottom panels), all groups had n = 10 independent biological samples. c Bar graphs represent the means ± SEM of CTL, n = 6; OPG, n = 9; independent biological samples. b One-way ANOVA with Bonferroni post-test correction; c Two-tailed Student’s t-test. Exact P values are indicated within each panel; N.S.; not significant. From left to right in each panel: b top panel: all P < 0.001, middle panel: all P < 0.001, bottom panel: all N.S.; c P = 0.005.

