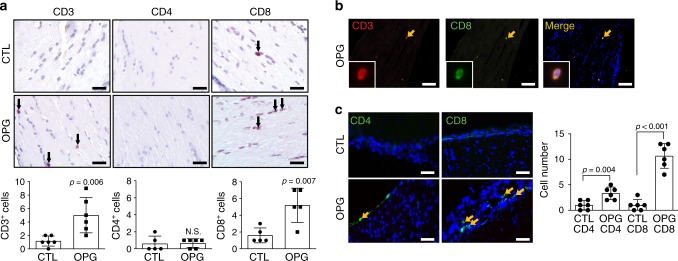
Fig. 5. Nf1 optic glioma mice exhibit increased numbers of CD8+ T cells in the meninges and optic nerve.
a Increased CD3+ and CD8+ T cell infiltration was observed in Nf1 optic glioma (OPG)-containing nerves relative to control (CTL) optic nerves. Few CD4+ T cells were detected in murine Nf1 OPG or control optic nerves. Black arrows denote representative immunopositive cells. Scale bars, 20 µm. b CD3+ (red); CD8+ (green) double-positive cells were found (yellow arrow) in murine Nf1 optic gliomas. c Increased numbers of meningeal CD4+ and CD8+ T cells (green) were present in Nf1 OPG mice relative to controls, where the number of CD8+ T cells was three-fold higher than CD4+ T cells. DAPI (blue) is used as a nuclear counter stain. Yellow arrows denote representative immunopositive cells. b, c Scale bars, 40 µm. a, c Bar graphs represent the means ± SEM of a (left panel) n = 6, (middle panel) CTL, n = 5; OPG, n = 6, (right panel) n = 5 or c n = 6 independent biological samples. a Two-tailed Student’s t-test, c One-way ANOVA with Bonferroni post-test correction. Exact P values are indicated within each panel; N.S.; not significant. From left to right in each panel: a left panel P = 0.006, middle panel N.S., right panel P = 0.007; c P = 0.004, P < 0.001.

