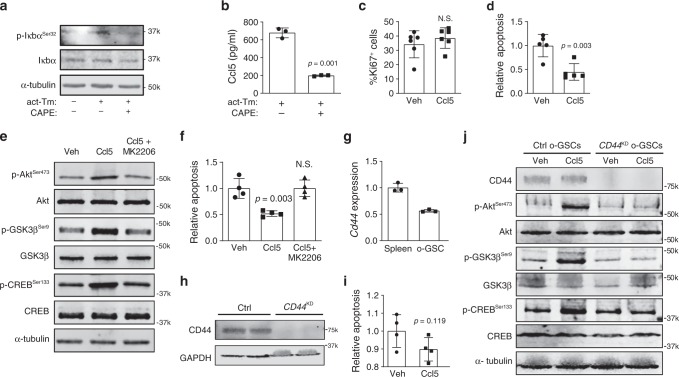
Fig. 7. T cell-mediated microglial Ccl5 production inhibits LGG apoptosis through CD44.
a Activated T cell CM (act-Tm) increased Iκbα phosphorylation in microglia, which was reduced following Caffeic acid phenethyl ester (CAPE; 100 µM) treatment. b CAPE treatment attenuated activated T cell CM (act-Tm)-mediated Ccl5 production in microglia. OPG o-GSCs were stimulated with Ccl5 at 300 pg ml−1 for 3 days. Whereas no increased optic glioma stem cell (o-GSC) proliferation (%Ki67+ cells) was observed c, o-GSC apoptosis (%TUNEL+ cells) was reduced in the Ccl5-treated group compared to vehicle (Veh, 0.1% BSA) treated controls d. e Immunoblotting reveals activation of the Akt-GSK3β-CREB anti-apoptosis pathway following Ccl5 treatment, which was inhibited by AKT inhibitor (20 μM MK2206) treatment. f 20 μM MK2206 treatment inhibited the anti-apoptosis effect of Ccl5 on o-GSCs (%TUNEL+ cells). g Cd44 expression in o-GSCs was detected by qRT-PCR using splenocytes as a positive control. Cd44 expression differences were not statistically analyzed. h CD44 knockdown (CD44KD) in o-GSCs reduces CD44 expression relative to the control shRNA-treated (Ctrl) cells. i Apoptosis (%TUNEL+ cells) of CD44KD o-GSCs was not inhibited by Ccl5 treatment. j Immunoblotting reveals that Ccl5 activation of the Akt/GSK3β/CREB anti-apoptosis pathway was inhibited by CD44 knockdown. All data are presented as the mean ± SEM. b–d, f, i These representative experiments were conducted with b n = 3, c n = 6, d n = 5; f, i n = 4 independent biological samples and were replicated two additional times with similar results. g Bar graphs represent the means ± SEM of n = 3 independent biological samples. b–d, i Two-tailed Student’s t-test; f One-way ANOVA with Bonferroni post-test correction. Exact P values are indicated within each panel; N.S.; not significant. From left to right in each panel: b P = 0.001; c N.S.; d P = 0.003; f P = 0.003, N.S.; i P = 0.119. a, e, h, j These are representative images of n = 3 independent biological samples examined over three independent experiments with similar results. Molecular weight markers are denoted at the right side of each blot.

