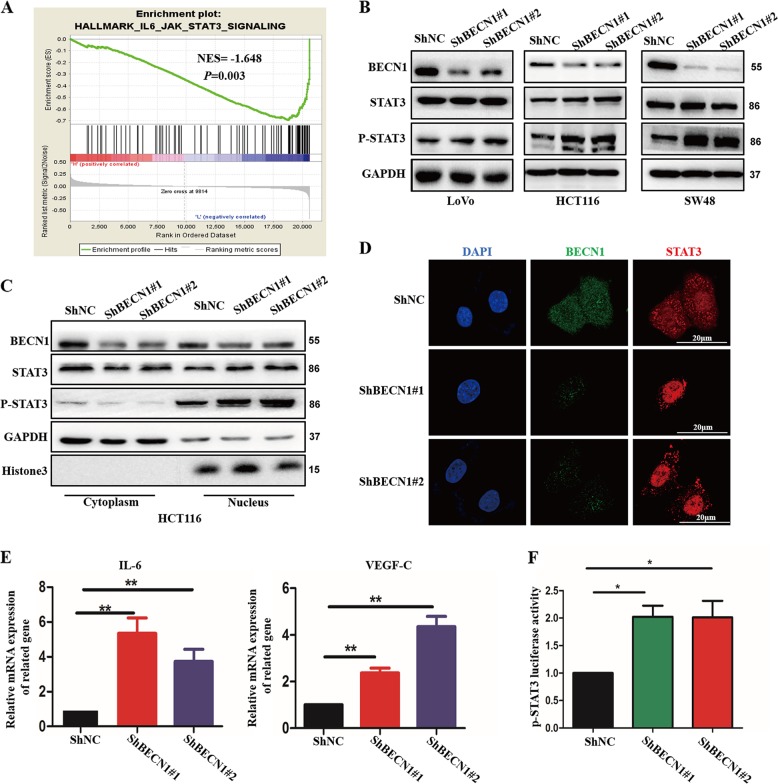
Fig. 3. Loss of BECN1 activates the phosphorylation of STAT3.
a GSEA plot indicating that BECN1 expression is inversely correlated with JAK2/STAT3 enrichment gene signatures in the GEO database (GSE17536). b Western blot analysis of the indicated proteins in LoVo, HCT116 and SW48 cells expressing shRNA-NC or shRNA-BECN1. c Western blot analysis was used to determine the level of nuclear STAT3 and p-STAT3 in HCT116 cells stably expressing negative control, shRNA-BECN1#1 or shRNA-BECN1#2. d An immunofluorescence assay was performed to examine STAT3 localization in HCT116 cells among the indicated groups. Scale bar: 20 μm. e qPCR was used to examine the expression of IL-6 and VEGF-C in the indicated HCT116 cells. f STAT3 luciferase activity was measured in the indicated HCT116 cells transfected with PGL6-p-STAT3 and pRL-TK plasmids after 24 h of incubation by a dual-luciferase assay. The values are the mean ± SD for triplicate samples (*P < 0.05 by an independent Student’s t test).

