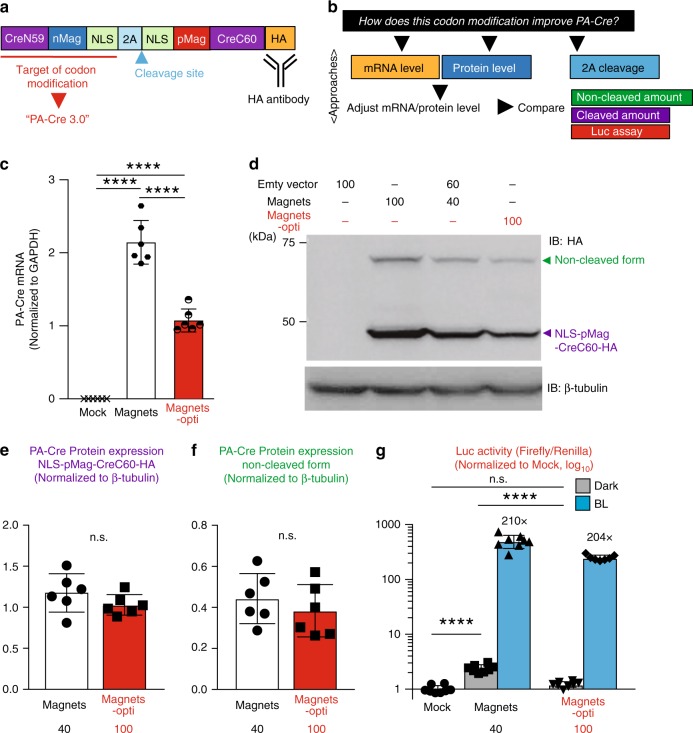
Fig. 3. Codon modification alters mRNA and protein expression and reduces dark leak in PA-Cre.
a Schematic representation of PA-Cre construct fused with HA-tag. HA-tag was inserted into the carboxyl-terminus of PA-Cre construct. Codons of CreN59-nMag-NLS component were modified in PA-Cre 3.0 (Magnets-opti). b Experimental Schematic to elucidate the mechanisms underlying PA-Cre 3.0 improvement in dark leak with codon modification. First, we quantified mRNA expression level of Magnets and Magnets-opti. Second, we measured the protein expression level. In accordance with these results, we modified transfection amount to adjust PA-Cre protein expression levels in Magnets and Magnets-opti and compared the loxP recombination efficiency using luciferase assay. c Quantification of CAG-driven PA-Cre transcripts in HEK 293T cells transfected with same amount of Mock (empty vector), Magnets-HA and Magnets-opti-HA plasmids using quantitative RT-PCR (****P < 0.0001; one-way ANOVA with multiple comparison, n = 6 biologically independent samples, mean ± s.d.). d Representative western blotting images of Magnets- and Magnets-opti-transfected HEK 293T cells. CAG-driven HA-tagged PA-Cre proteins were detected by using anti-HA antibody. Loading schematics showed transfection DNA amounts of PA-Cre plasmids. Empty vector was used to adjust total amount of transfection for the cells. Protein expression of Magnets was adjusted to Magnets-opti expression, modifying Magnets plasmid DNA amount in a series of transfections (Fig. S6b). Top bands (~75 kDa), non-cleaved form of PA-Cre; bottom bands, cleaved carboxyl-terminal portion of PA-Cre construct (NLS-pMag-CreC60-HA). β-tubulin was examined as an internal control in the cells (n = 2 biologically independent experiments). e Quantification of protein expression of cleaved component of PA-Cre, NLS-pMag-CreC60-HA. (n.s. not significant, Magnets 40 v.s. Magnets-opti 100; Two-tailed t test, n = 6 biologically independent samples, mean ± s.d.). f Quantification of protein expression of non-cleaved PA-Cre form. (n.s. not significant, Magnets 40 v.s. Magnets-opti 100; Two-tailed t test, n = 6 biologically independent samples, mean ± s.d.). g Comparison of PA-Cre activities between Magnets and Magnets-opti using the same protein expression amounts. Luc assays were conducted with double-floxed inverted Fluc reporter in HEK 293T cells. Transfected cells were kept in the dark or under blue light (blue LED, 447.5 nm, 8.28 W/m2, repeated 20 s light and 60 s dark for 12 h). The black numbers show fold-induction value (n.s. not significant, ****P < 0.0001; one-way ANOVA with multiple comparison among Mock, Magnets dark, and Magnets-opti dark, n = 8 biologically independent samples, mean ± s.d.). Source data are provided as a Source Data File.

