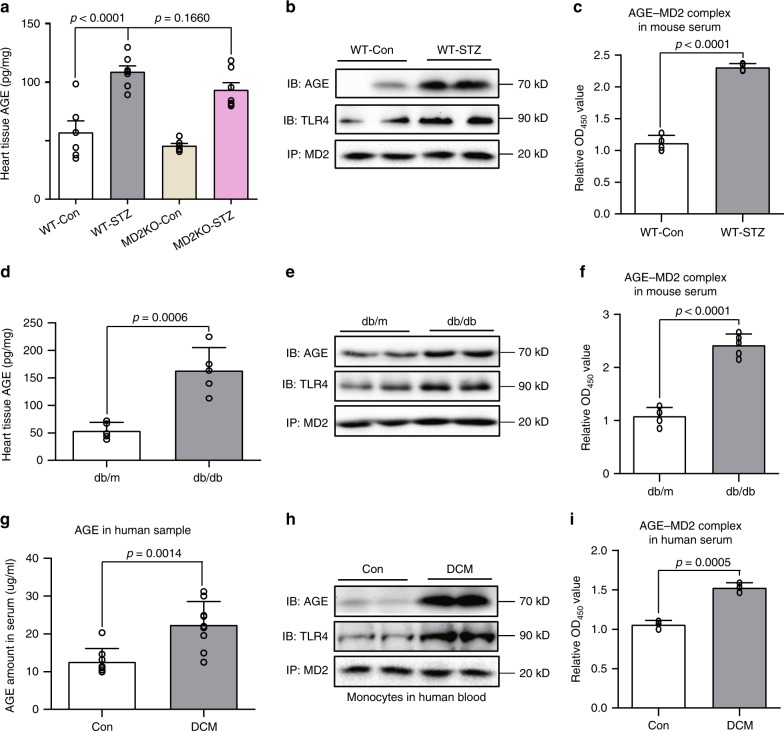
Fig. 7. AGE-MD2 complexes in serum and cardiac tissues in diabetes.
a Levels of AGE products in heart tissues of type 1 mouse model of diabetes. C57BL/6 wild-type and MD2KO mice were made diabetic by streptozotocin. Heart tissues were harvested at 16 weeks and levels of AGE products were determined by ELISA [experimental groups are as described in Fig. 2; means ± SEM; n = 6 per group]. b Representative blots showing co-immunoprecipitation of MD2-AGE complexes in heart tissues from type 1 mouse model of diabetes. Tissues from WT-Con and WT-STZ mice at 16 weeks after confirmation of diabetes were examined [n = 6; two samples per group shown]. c MD2-AGE complexes were measured in serum of WT-Con and WT-STZ mice at 16 weeks [means ± SEM; n = 4]. d Levels of AGE products in heart tissues of type 2 mouse model of diabetes. Heart tissues from db/m (controls) and db/db (diabetic) mice were harvested at 16 weeks. AGE products were determined by ELISA [means ± SEM; n = 5 per group]. e Representative blots showing co-immunoprecipitation of MD2-AGE complexes in heart tissues from type 2 mouse model of diabetes [experimental groups are as shown in panel D; n = 6; two samples per group shown]. f MD2-AGE complexes were measured in serum of db/m and db/db mice at 16 weeks [means ± SEM; n = 5]. g Serum levels of AGE products in healthy human subjects and diabetic subjects with cardiomyopathy [Co = healthy subjects (n = 8), DCM = diabetic subjects with cardiomyopathy (n = 9); means ± SEM]. h Representative blots showing AGE-MD2 complexes in human blood mononuclear cells isolated from healthy subjects (Con) and diabetic subjects (n = 6; two samples per group shown). i MD2-AGE complexes in serum samples from human subjects [means ± SEM; n = 3 per group]. Source data are provided as a Source Data file. P-values by one-way ANOVA in a followed by Tukey’s post hoc test are indicated. P-values by unpaired t test are indicated in c, d, f, g and i.

