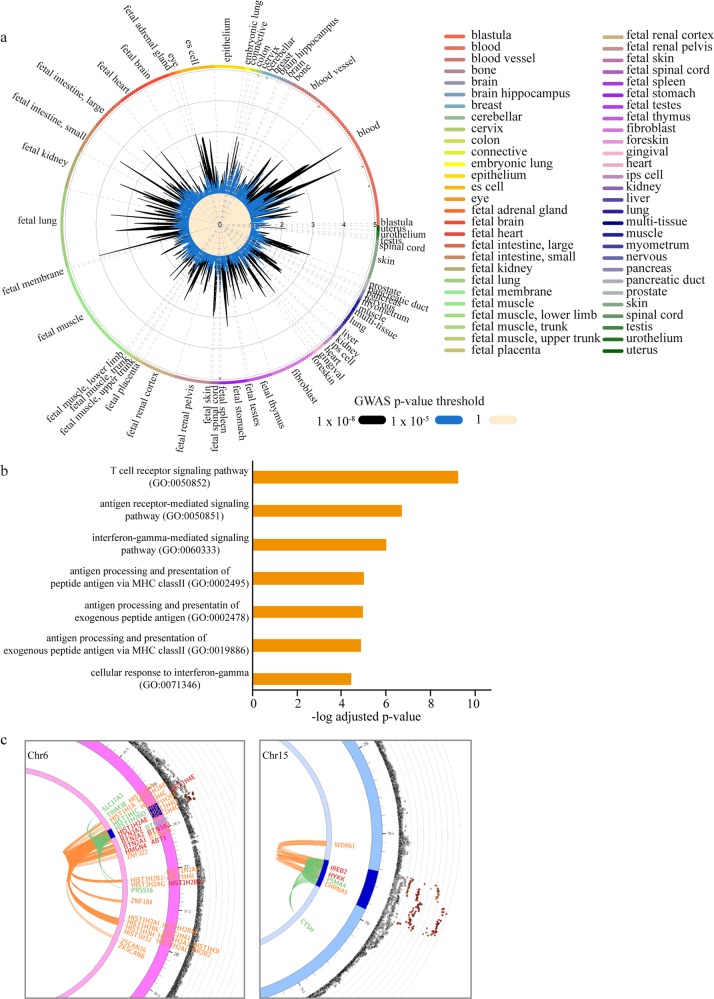
Fig. 1. Mapping and annotation of parental lifespan GWAS.
a Lifespan gene variant enrichment showed by radial lines (numbers correspond to fold enrichment value) at two GWAS P value thresholds (P < 1 × 10⁻⁵ in blue and P < 1 × 10⁻⁸ in black) in different tissues and cell types. Significant enrichments are represented by dots in the outer circle. b Gene ontology for 125 blood cis-regulated eGenes mapped from lifespan; graph showing the seven GO terms with the lowest P values. c Zoomed-in circos plots of genetic association data and chromatin interactions in the extended histone locus in chromosome 6 and in the 15q25.1 locus. Names of the genes are in orange for genes mapped only by chromatin interactions, in green for genes mapped only by eQTL, and in red for genes mapped by both chromatin interactions and eQTLs.

