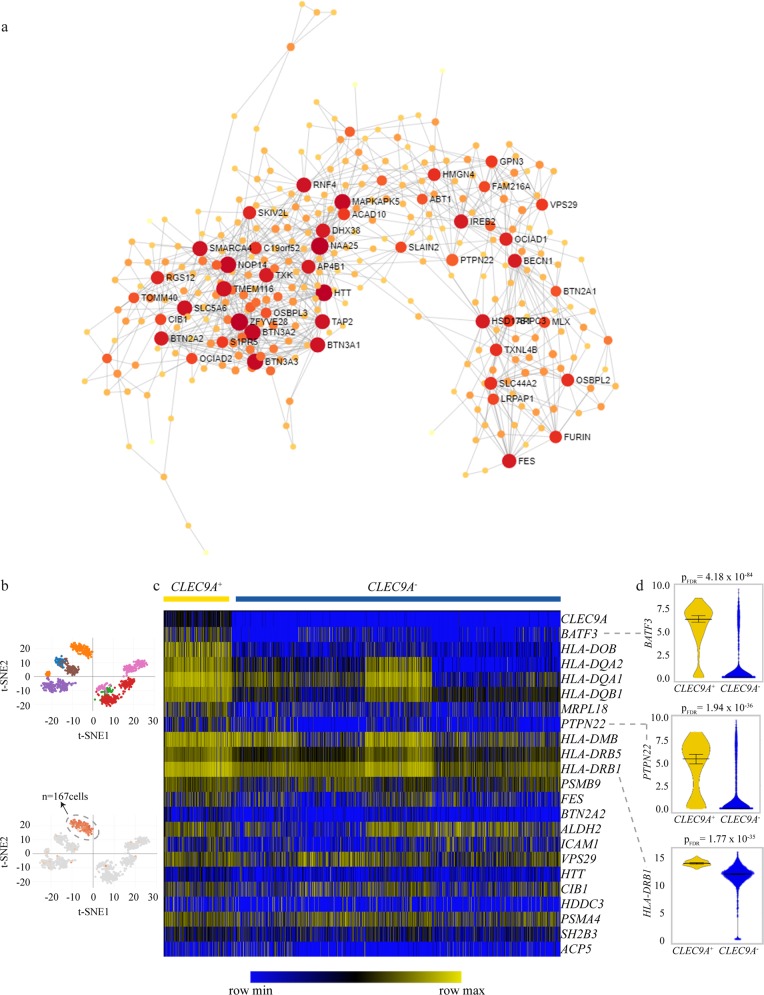
Fig. 2. Blood eGenes network and cell enrichment.
a Reduced network topology of key central nodes and interactions. b–d Analysis of single-cell RNA-sequencing data of monocytes and dendritic cells (GEO accession number GSE94820). b t-SNE graphs showing a cell cluster expressing CLEC9A. c Heatmap of gene enrichment in CLEC9A− and CLEC9A+ cell clusters. d Violin plots showing data distribution (vertical bars illustrate median and 95% CI) and comparing expression in CLEC9A− and CLEC9A+ cell clusters.

