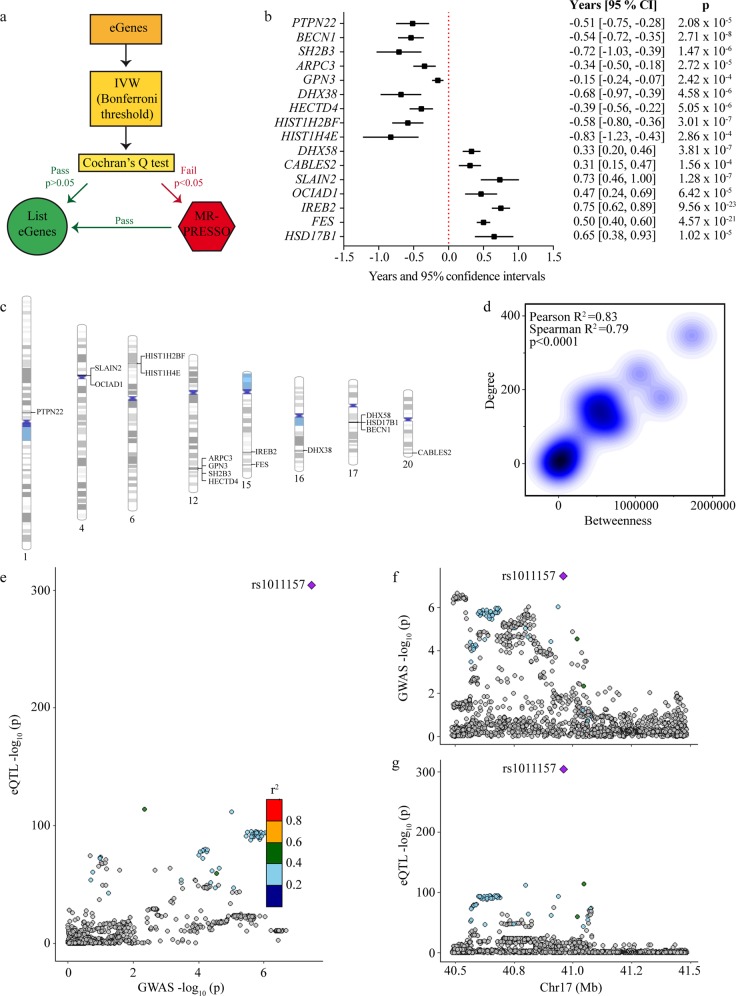
Fig. 3. Causal inference on lifespan cis-eQTL genes.
a Scheme of Mendelian randomization analysis strategy. b Forest plots indicating the effects (in years) on lifespan of the 16 blood eGenes considered to be causal. c Chromosomal ideograms for the genomic locations of the lifespan causally associated eGenes. d Kernel density plots between the degree and the betweenness of the 16 causally associated eGenes, Pearson’s and Spearman’s correlations. e–g Bayesian colocalization analysis between blood cis-eQTLs and lifespan genetic association data. e LocusCompare showing colocalization signal for BECN1, with rs1011157 having the lowest P value for both cis-eQTL and lifespan genetic association. f Genetic association signal for the GWAS (parental lifespan). g Genetic association signal for the blood cis-eQTL.

