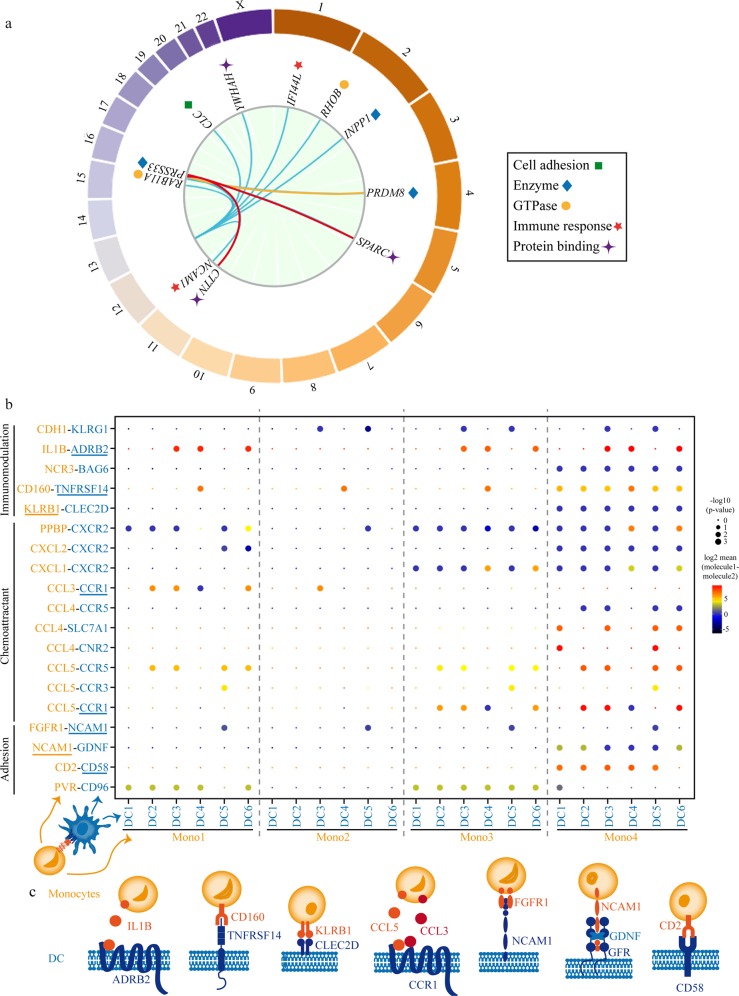
Fig. 4. Trans-eQTLs genes.
a Circos illustrating shared genetic signal between cis- and trans-regulated genes; trans-regulated genes showing shared genetic signal with cis-regulated SH2B3 (cyan), IREB2 (yellow), and FES (red). b Single-cell gene expression (GEO accession number GSE94820) analysis showing CellPhoneDB predicted ligand–receptor interactions between monocytes and dendritic cells (DCs); on the y-axis, molecules identified as lifespan trans-QTLs are underlined; molecules expressed by monocytes and DCs are represented in yellow and blue, respectively. c Graphic representation of predicted molecular interactions between monocytes and DCs and including lifespan trans-eQTLs.

