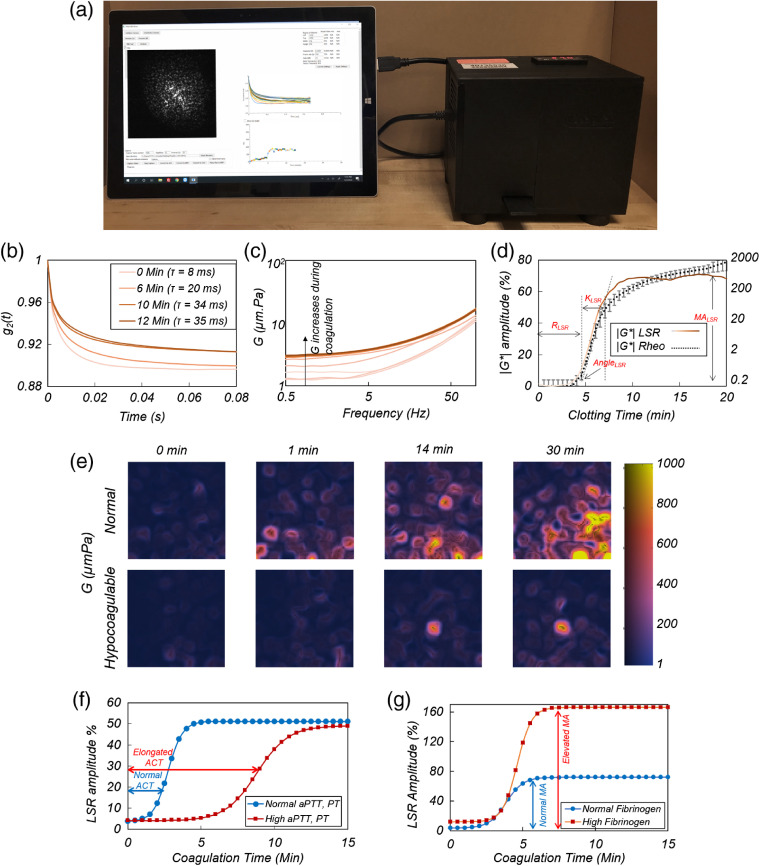
Fig. 4.
(a) Handheld LSR device (adapted with modifications from Ref. 43). (b) Temporal intensity autocorrelation curves measured from a blood sample during coagulation. The curves slow down as the blood clot forms, as appreciated from the increase in the speckle decorrelation time constant (adapted with modification from Ref. 38). (c) Frequency-dependent shear viscoelastic modulus, , measured by LSR increases during coagulation. (d) A typical LSR amplitude curve obtained by plotting the at a specific frequency for normal blood, along with the trend measured using a rheometer, displayed on the secondary axis. The representation of the parameters, , , angle, and MA, is displayed. (e) Spatial variation in visualized in a drop of blood showing emerging initial microclots that form early in the coagulation process, the hypocoagulable sample shows negligible clotting (adapted with modifications from Ref. 41). Scale bars are . (f) LSR amplitude curves for a patient with prolonged aPTT and PT. (g) LSR amplitude curves for a patient with elevated fibrinogen, compared with normal controls (adapted with modification from Ref. 51).

