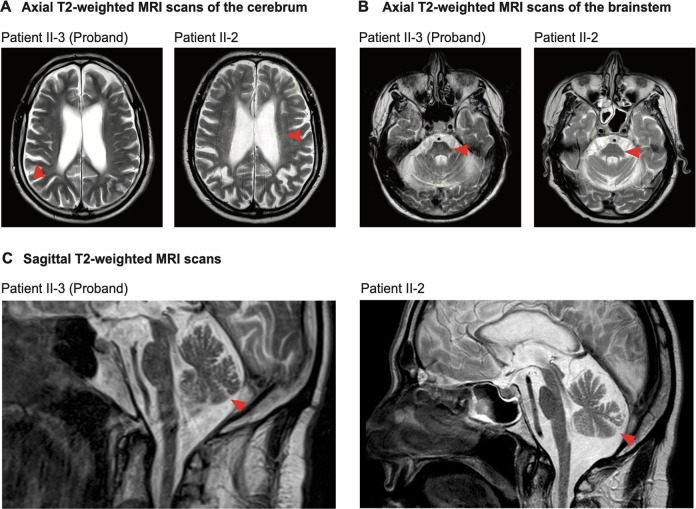
Fig. 1. Axial and sagittal T2-weighted MRI scans of the patients’ brains.
a Axial T2-weighted MRI scans of the patients’ cerebrum. Red arrows denote areas of extensive atrophy. For patient II-2 the red arrow also denotes small, discrete, periventricular T2-hyperintense white matter lesions. b Axial T2-weighted MRI scans of the patients’ brainstem. Red arrows denote atrophy in the pons. c Sagittal T2-weighted MRI scans of the patients. Red arrows denote atrophy in the cerebellum.

