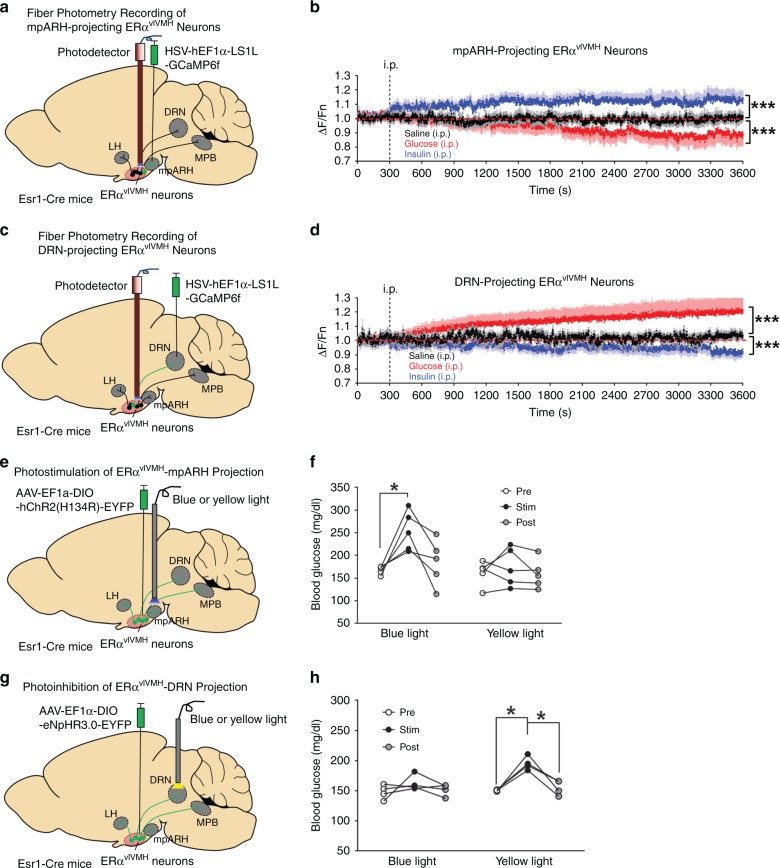
Fig. 5. Distinct ERαvlVMH-downstream projections prevent hypoglycemia.
a Schematic strategy using the HSV-hEF1α-LS1L-GCaMP6f virus and fiber photometry to monitor neural activity of female mpARH-projecting ERαvlVMH neurons. b Quantifications of neural activity of mpARH-projecting ERαvlVMH neurons in response to i.p. saline, i.p. 1 g per kg glucose, or i.p. 1.5 U per kg insulin. N = 6 mice per group. ***P < 0.0001 vs. saline group in two-way ANOVA analysis followed by post hoc Sidak tests. c Schematic strategy using the HSV-hEF1α-LS1L-GCaMP6f virus and fiber photometry to monitor neural activity of female DRN-projecting ERαvlVMH neurons. d Quantifications of neural activity of DRN-projecting ERαvlVMH neurons in response to i.p. saline, i.p. 1 g per kg glucose, or i.p. 1.5 U per kg insulin. N = 5 mice per group. ***P < 0.0001 vs. saline group in two-way ANOVA analysis followed by post hoc Sidak tests. e Schematic strategy using the AAV-EF1α-DIO hChR2(H134R)-EYFP to selectively activate the female ERαvlVMH→mpARH projection. f Effects of blue and yellow (as controls) light pulses on blood glucose. N = 5 mice per group. *P = 0.033 between the stimulation period and prestimulation period in one-way ANOVA analysis followed by post hoc Sidak tests. g Schematic strategy using the AAV-EF1α-DIO-eNpHR3.0-EYFP to selectively inhibit the female ERαvlVMH→DRN projection. h Effects of yellow and blue (as controls) light pulses on blood glucose. N = 4 mice per group. Between prestimulation period and stimulation period *P = 0.0111; between poststimulation period and stimulation period *P = 0.031 in one-way ANOVA analysis followed by post hoc Sidak tests. Results in b and d are shown as mean ± SEM. Source data are provided as a Source Data Fig. 5.

