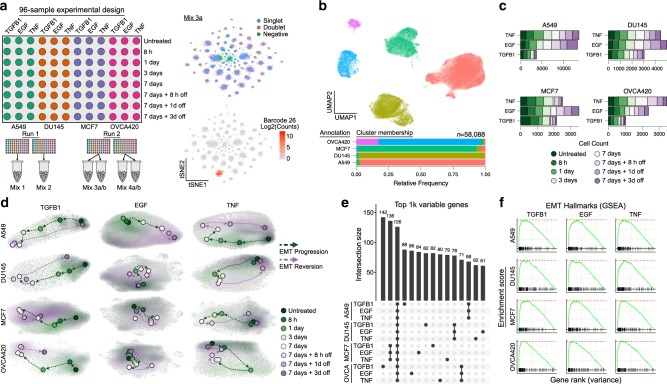
Fig. 1. Multiplexed scRNA-seq profiling of 12 EMT time course experiments.
a Schematic of the 96-well experimental design for the 12 EMT time course experiments (left), and t-SNE embeddings of the MULTI-seq barcode counts, demonstrating strong signal for demultiplexing (right). b UMAP embedding of aggregated expression data of all data, colored by unsupervised clustering (top), and a graph showing the relative proportion of annotations for each cell line assigned to each cluster after demultiplexing (bottom). c Graph showing the number of cells captured for each time course experiment. d UMAP embeddings of each of the 12 time course experiments. Grey dots correspond to individual cells, shaded regions represent the related sample density for each time point, and colored dots correspond to the maxima of the density function. e UpSet plot showing the intersections of the top 1000 variable genes of each time course experiment. f GSEA plots showing the NES for the EMT hallmark genes in the variance-ranked genes for all conditions.

