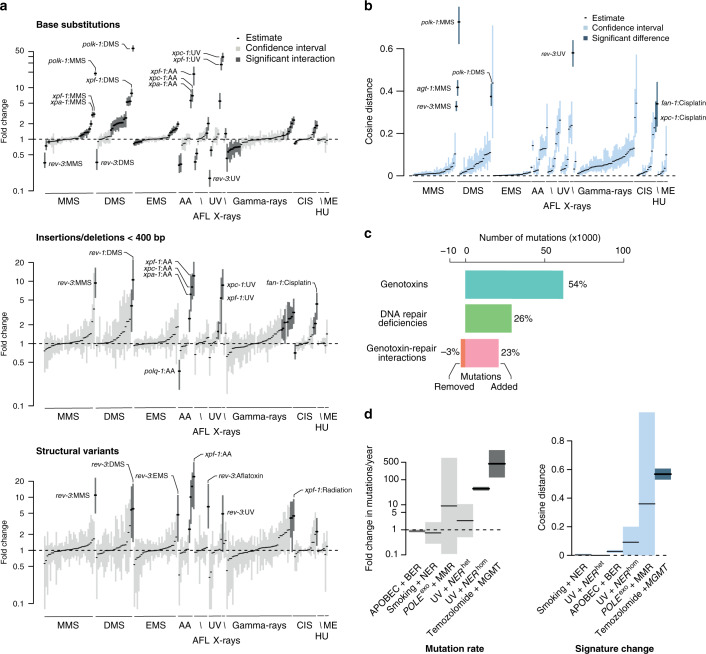
Fig. 2. Widespread and diverse genotoxin-repair interactions in C. elegans and cancer.
a Estimated fold changes between observed numbers relative to expected numbers of mutations based on additive genotoxin and DNA repair deficiency effects shown for base substitutions (upper panel), insertions/deletions (middle panel), and structural variants (lower panel) for all genotoxins. AFL - aflatoxin B1, CIS - cisplatin, HU - hydroxyurea, ME - mechlorethamine. A value of 1 indicates no change. Black lines denote point estimates. Interactions with fold changes significantly above or below 1 (as per testing whether the squared log ratio between mutation numbers induced by a genotoxin in mutants versus wild-type follows the 2 distribution at 5% FDR) are shown as dark grey, the rest as light grey bars with their width indicating confidence interval. b Changes in spectra of genotoxin-induced mutations. Black lines denote point estimates. Interactions with cosine distances larger than 0.2 are shown with dark blue confidence intervals, others are shown in light blue. c Numbers of mutations attributed to genotoxins (blue) and DNA repair deficiencies (green), as well as positive interactions (pink) and negative interactions (orange) between genotoxins and DNA repair deficiencies. d Summary of interaction effects between selected DNA repair pathway deficiencies and DNA damage-associated mutational signatures in human cancers. Left: Changes in age-adjusted mutation burden. Right: Change in mutational signatures. Black lines denote the average values and bars correspond to 95% confidence intervals. Significant interactions are shown in darker colour (as per testing whether the squared log ratio between mutation numbers expected in deficient versus proficient samples follows the 2 distribution at 5% FDR, or whether the cosine similarity between the spectra is lower than 0.8).

