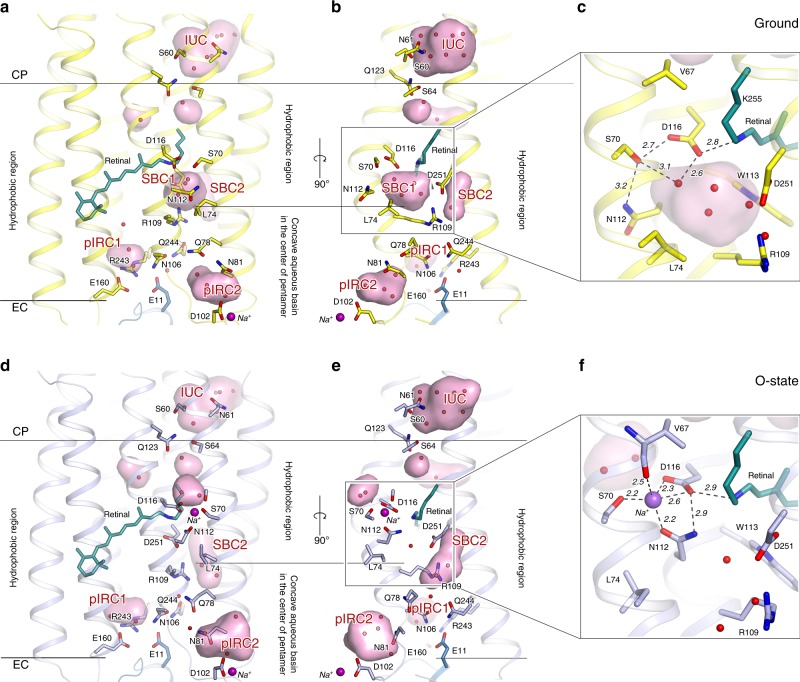
Fig. 2. Overall comparison of the ground and O-states of KR2.
a, d Side view of the KR2 protomer in the ground (yellow, PDB ID: 6REW) and O- (blue, present work) states. b, e View from the side of the helices A and B. Membrane hydrophobic/hydrophilic boundaries were calculated using PPM server56 and are shown with the black lines. The membrane boundary at the extracellular side is located at two levels for the inner and outer parts of the KR2 pentamer, respectively. Helices A and B face the concave aqueous basin, formed in the central pore of the pentamer and helices C–G face the lipid bilayer, surrounding the pentamer. Water molecules are shown as yellow and blue spheres for ground and O-state, respectively. Helices A and B are hidden for clarity. c, f Detailed view of the RSB region of the ground and the O-state of KR2. Cavities (ion-uptake cavity—IUC; the Schiff base cavities 1 and 2—SBC1 and SBC2, respectively; putative ion-release cavities 1 and 2— pIRC1 and pIRC2, respectively) inside the protein were calculated using HOLLOW57 shown in pink and marked with red labels. Retinal cofactor is colored teal. Water molecules are shown with red spheres. Sodium ion is shown with a purple sphere. Hydrogen bonds involving S70, N112, D116, D251, and RSB are shown with black dashed lines. The lengths of the shown hydrogen bonds are shown with bold italic numbers and are in Å. Helix A and SBC2 are hidden for clarity.

