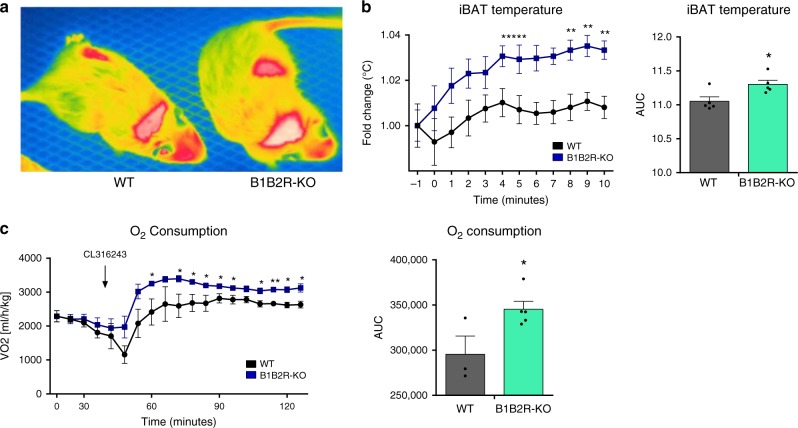
Fig. 7. Effects of CL316243 injection on iBAT temperature and O2 consumption.
a Thermographic image of a WT and B1B2R-KO mouse 4 min after subcutaneous injection of CL316243 in the area of iBAT. b Time course of temperature increase in iBAT after CL316243 injection (n = 5 animals for PBS and n = 6 animals for B1B2R-KO left graph; n = 5 animals for AUC). c Time course of O2 consumption after CL316243 injection (n = 3 animals for PBS and n = 5 animals for B1B2R-KO both graphs). Data are presented as means ± s.e.m. (bars). *P < 0.05, **P < 0.01 versus corresponding controls; two-tailed unpaired Student’s t-test. Source data are provided as a Source data file.

