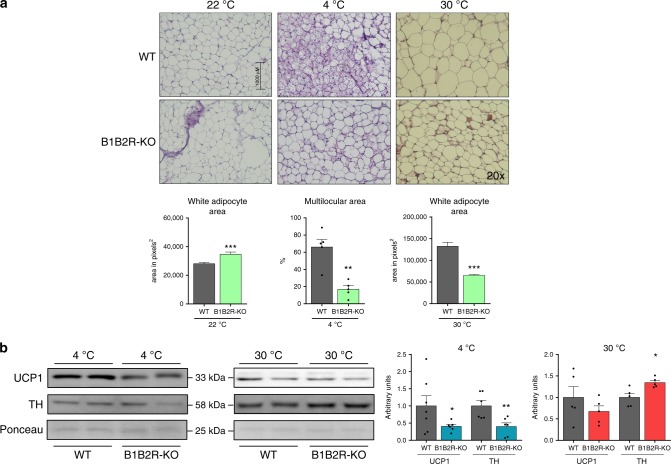
Fig. 8. Effects of temperature challenges on iWAT of B1B2R-KO mice.
a H&E-stained histological sections and quantification (at least three different pictures) of cell size and browning area in iWAT from 3 months old WT and B1B2R-KO mice exposed to 4 °C or 30 °C for 1 week. b Expression and quantification of UCP1 and TH protein (n = 6 animals at 4 °C for UCP1 and TH except WT 4 °C UCP1 where n = 7; n = 5 at 30 °C all conditions). Data are presented as means ± s.e.m. (bars). *P < 0.05, **P < 0.01, and ***P < 0.001 versus corresponding controls; two-tailed unpaired Student’s t-test. Source data are provided as a Source data file.

