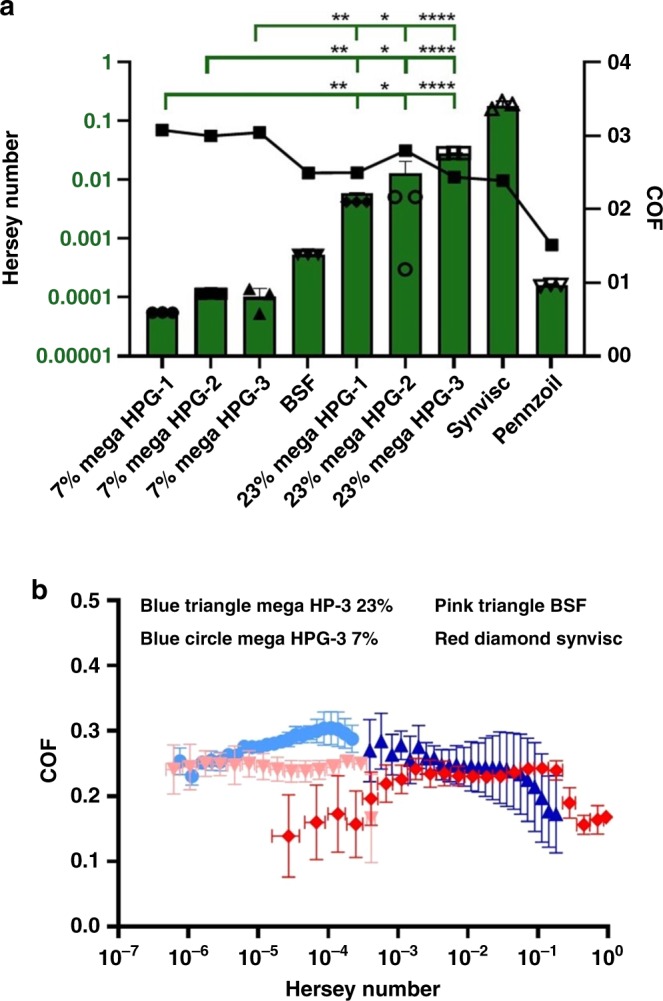
Fig. 3. Lubrication characteristics of mega HPGs.

a Graph of the Hersey number at which each group transitions from boundary mode to mixed mode lubrication (left y-axis and green bars). The COF at the time each lubricant transitions from boundary to mixed mode lubrication (right y-axis, black symbols). Error bars represent standard deviation, N = 3 replicates; one-way ANOVA used to compare groups, statistical differences indicated by asterisk, where *p < 0.05, **p < 0.01, ****p < 0.0001. For full list of statistical results see Supplementary Information. b. Stribeck curves for best preforming mega HPG (mega HPG-3) at both 7 and 23 w/v%, as well as two controls, BSF and Synvisc One. Error bars represent standard deviation, N = 3 replicates.
