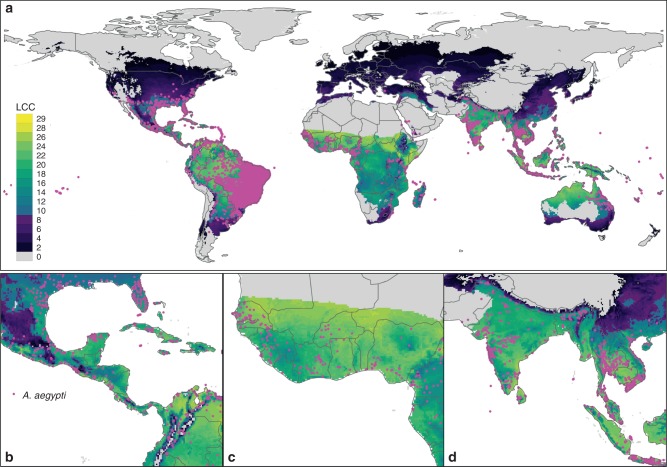
Fig. 1. Distribution of annual LCC of Ae. aegypti with occurrence data overlaid.
Maps indicate the total number of LCC per year at the global scale (a), Central America (b), West Africa (c) and South East Asia (d). Colour represents the number of LCC. Areas in which LCC < 10, corresponding to the threshold used in subsequent analysis (i.e. Fig. 4), are shown with a darker palette (indigo-black, note legend). Grey colour represents unsuitable areas for Ae. aegypti development. Magenta dots represent presence records of Ae. aegypti (refs. 49,84).

