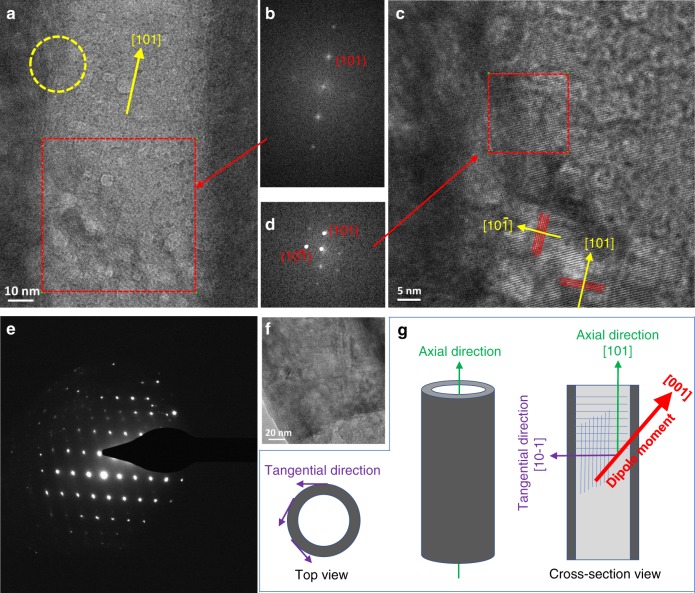
Fig. 4. Crystallographic orientation and atomic structure of the TiO2 tube.
a A typical TEM image of a single tube in the Li-TiO2 sample, prepared by cutting the tube film along the axial direction by focused ion beam (FIB, see Supplementary Fig. 9) and (b) FFT images of the a indicated with red dash square. c An enlarged image of the zone in a marked with a yellow dash circle. d The FFT images of the c indicated with red dash square. They assisted to index the lattice fringes and crystallographic orientation of the tube. e Selected area electron diffraction patterns recorded from a single TiO2 tube and (f) showing the corresponding part of the tube for recording the patterns. g Schematic of the axial and tangential directions of the tubes. The direction of dipole moment, axial crystallographic orientation, and tangential direction are illustrated in the cross-section view.

