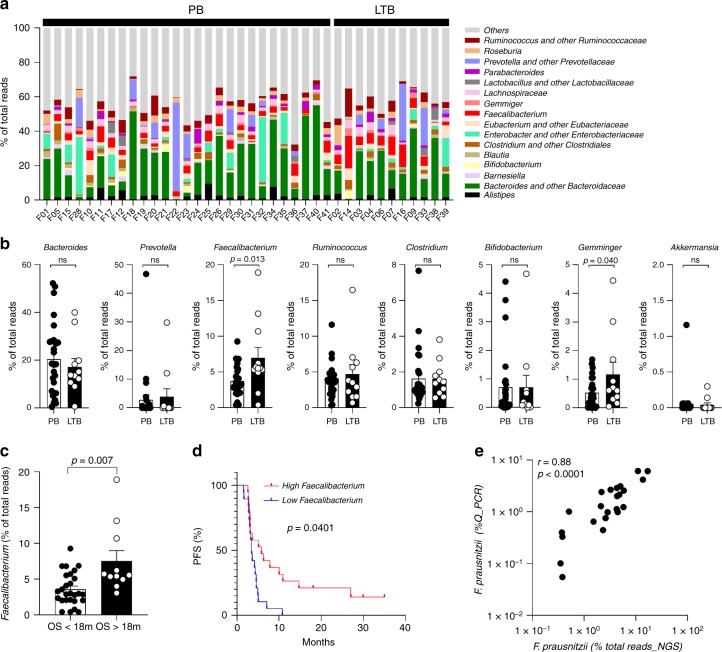
Fig. 1. Baseline gut microbiota composition in patients with MM.
a Relative abundance of dominant (>1% of total reads) gut microbial genera are represented for each patient at V1 (baseline, n = 38). b Histograms of relative abundance of eight genera at baseline between poor (PB) and long-term clinical benefit (LTB) patients. Mann–Whitney two-tailed tests were used. p-values are indicated on each graph. c Histograms of relative abundance of Faecalibacterium according to overall survival (OS over 18 months (OS > 18 m) and OS under 18 months (OS < 18 m)) in patients. Mann–Whitney two-tailed tests were used. p-values are indicated on the graph. d, Kaplan–Meier curve of progression-free survival (PFS) of patients classified into two groups according to the median relative abundance of Faecalibacterium (n = 38). Log-rank (mantel-cox) test was used. e Pearson correlation between the relative abundance of Faecalibacterium assessed by 16S rDNA analysis (% of total reads NGS) and Q-PCR (% Q-PCR) analyses on feces at baseline (n = 24). r and p values are indicated on each graph. ns, not significant.

