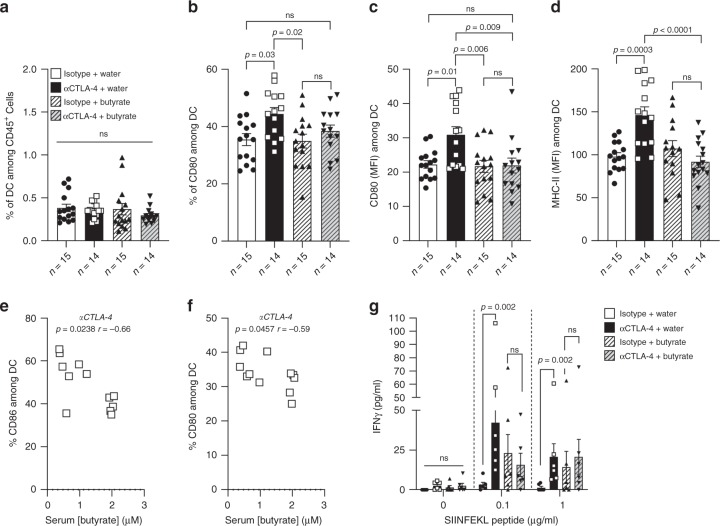
Fig. 4. Sodium butyrate inhibited anti-CTLA-4-induced DC maturation and T cell priming.
a Percentages of dendritic cells (DC defined as CD3-CD19−NKp46−CD11c+MHC-II+ among CD45+ cells) in tDLN from three pooled independent experiments. b Percentages (%) of CD80 among DC in the tDLN from pooled independent experiments. c Mean fluorescence intensity of CD86 among DC in the tDLN. d Mean fluorescence intensity (MFI) of MHC class-II among DC in the tDLN. e, f Correlation between the percentage of CD86 (e) and CD80 (f) and serum butyrate concentration in mice treated with anti-CTLA-4 (n = 12 mice) g IFNγ concentration after ex vivo restimulation of tDLN with MHC-I OVA (SIINFEKL) peptides from one representative experiment out of two independent experiments (n = 6 mice per group). p-values are indicated on each graph; Each dot represent one mouse (a, b, c, d, e, f and g). n (number of mice per group) is indicated on the graph (a, b, c and d). Bars represent mean +/− sem (a, b, c, d and g). One-way ANOVA followed by Tukey’s tests for multiple comparisons was used (a, b, c and d). Spearman test were used (e and f). Two-tailed Mann–Whitney tests were used (g). p-values are indicated on each graph; ns, not-significant.

