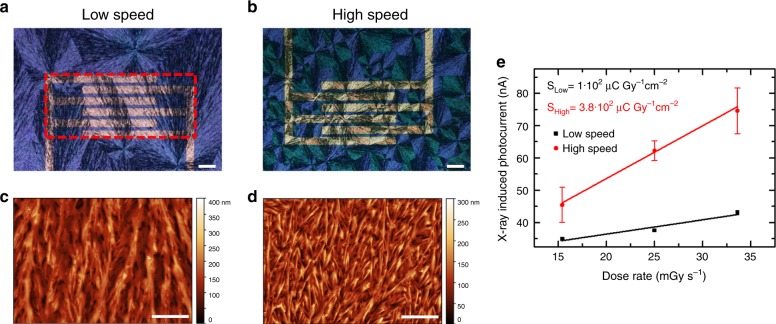
Fig. 2. Impact of film morphology (grain size/density) on X-ray detection sensitivity.
Cross-polarized optical microscope images and AFM topography images of pristine TIPS-pentacene thin films deposited by BAMS at a, c low speed (4 mm s−1) and b, d high speed (28 mm s−1). The dashed red box in a indicates the pixel area used for the calculation of the sensitivity. Scale bar: 100 µm. e X-ray induced photocurrent versus dose rate plot for the two types of films and relative calculated sensitivity, obtained under irradiation by a Mo-target X-ray tube. The error bars refer to the statistical fluctuations of the signal amplitude over three on/off switching cycles of the X-ray beam in the same condition.

