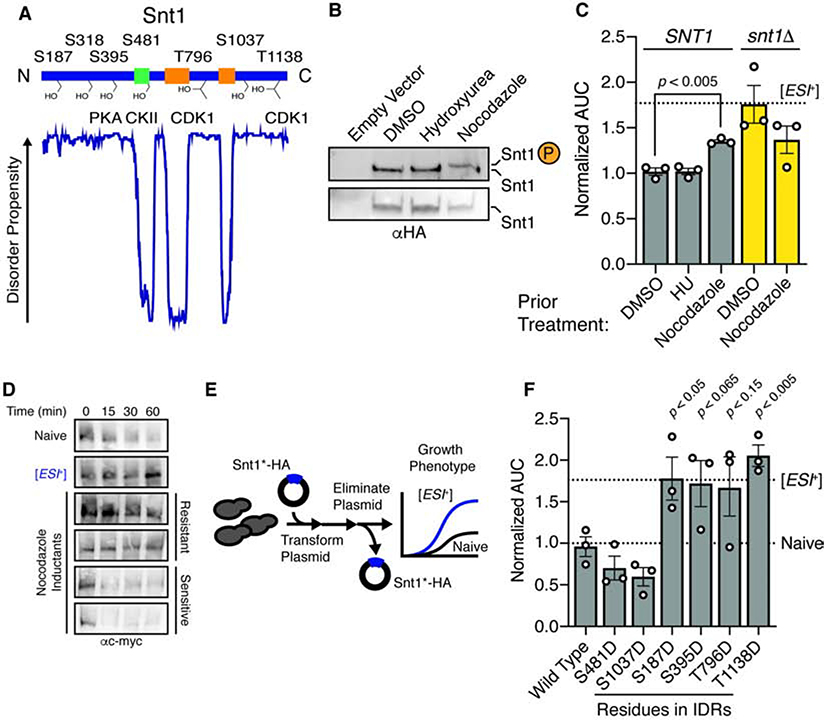
Figure 2. Snt1 phosphorylation triggers [ESI+].
A, Snt1 domain architecture and known phosphorylation sites. Intrinsic disorder profile predicted using DISOPRED2. B, Immunoblot of phosphoprotein-impeding gel (‘phostag’; upper panel) and SDS-PAGE (lower panel) of nocodazole- or hydroxyurea-arrested cells. C, Normalized AUC for wild type or snt1Δ strains previously arrested with the indicated agent, propagated for >100 generations, and treated with 7.5 mM ZnSO4. Dashed line indicates AUC value for a concurrently treated [ESI+] type strain. D, Immunoblot of immunopurified Snt1–13xmyc subjected to limited proteolysis. Two protease-resistant and two protease-sensitive single colony isolates are presented. E, Schematic of phosphomimetic induction of [ESI+]. F, Normalized AUC in 7.5 mM ZnSO4 for phosphomimetic inductants using a galactose-inducible promoter in 2% raffinose (resulting in very low expression), for ~25 generations, followed by elimination of the plasmid. Dashed lines represent growth of type strains (naïve and [ESI+]). Error bars are SEM calculated from three independent inductions. See also Figure S2.

