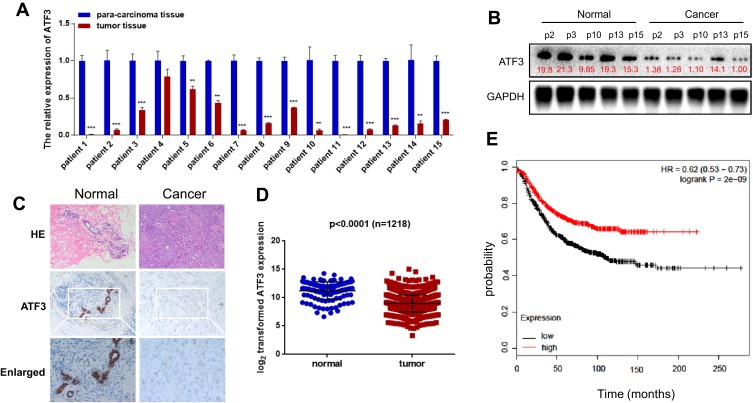
Figure 1.
Expression of ATF3 in human breast cancer. (A) ATF3 expression levels were evaluated using qRT-PCR in 15 paired breast carcinoma and adjacent normal tissues. (B) The expression of ATF3 protein in breast carcinoma tissues and paired adjacent normal controls. (C) Hematoxylin and eosin (H&E) staining of normal (left panel) and breast cancer (right panel) tissue sections showed histologic features (original magnification, ×100, upper pannel), immunohistochemical staining (IHC) of ATF3 (original magnification, ×100, middle panel;×200, lower panel). (D) Analysis of TCGA data for 1218 breast cancer samples. (E) Kaplan-Meier plots were constructed for 1764 breast cancer patients stratified by the expression of ATF3 (low=884, high=880). **P < 0.01, ***P < 0.001 for t-test.
Abbreviations: GAPHD, glyceraldehydes-3-phosphate dehydrogenase; HE, hematoxylin and eosin; HR, hazard ratio; TCGA, The Cancer Genome Atlas.

