Figure 2.

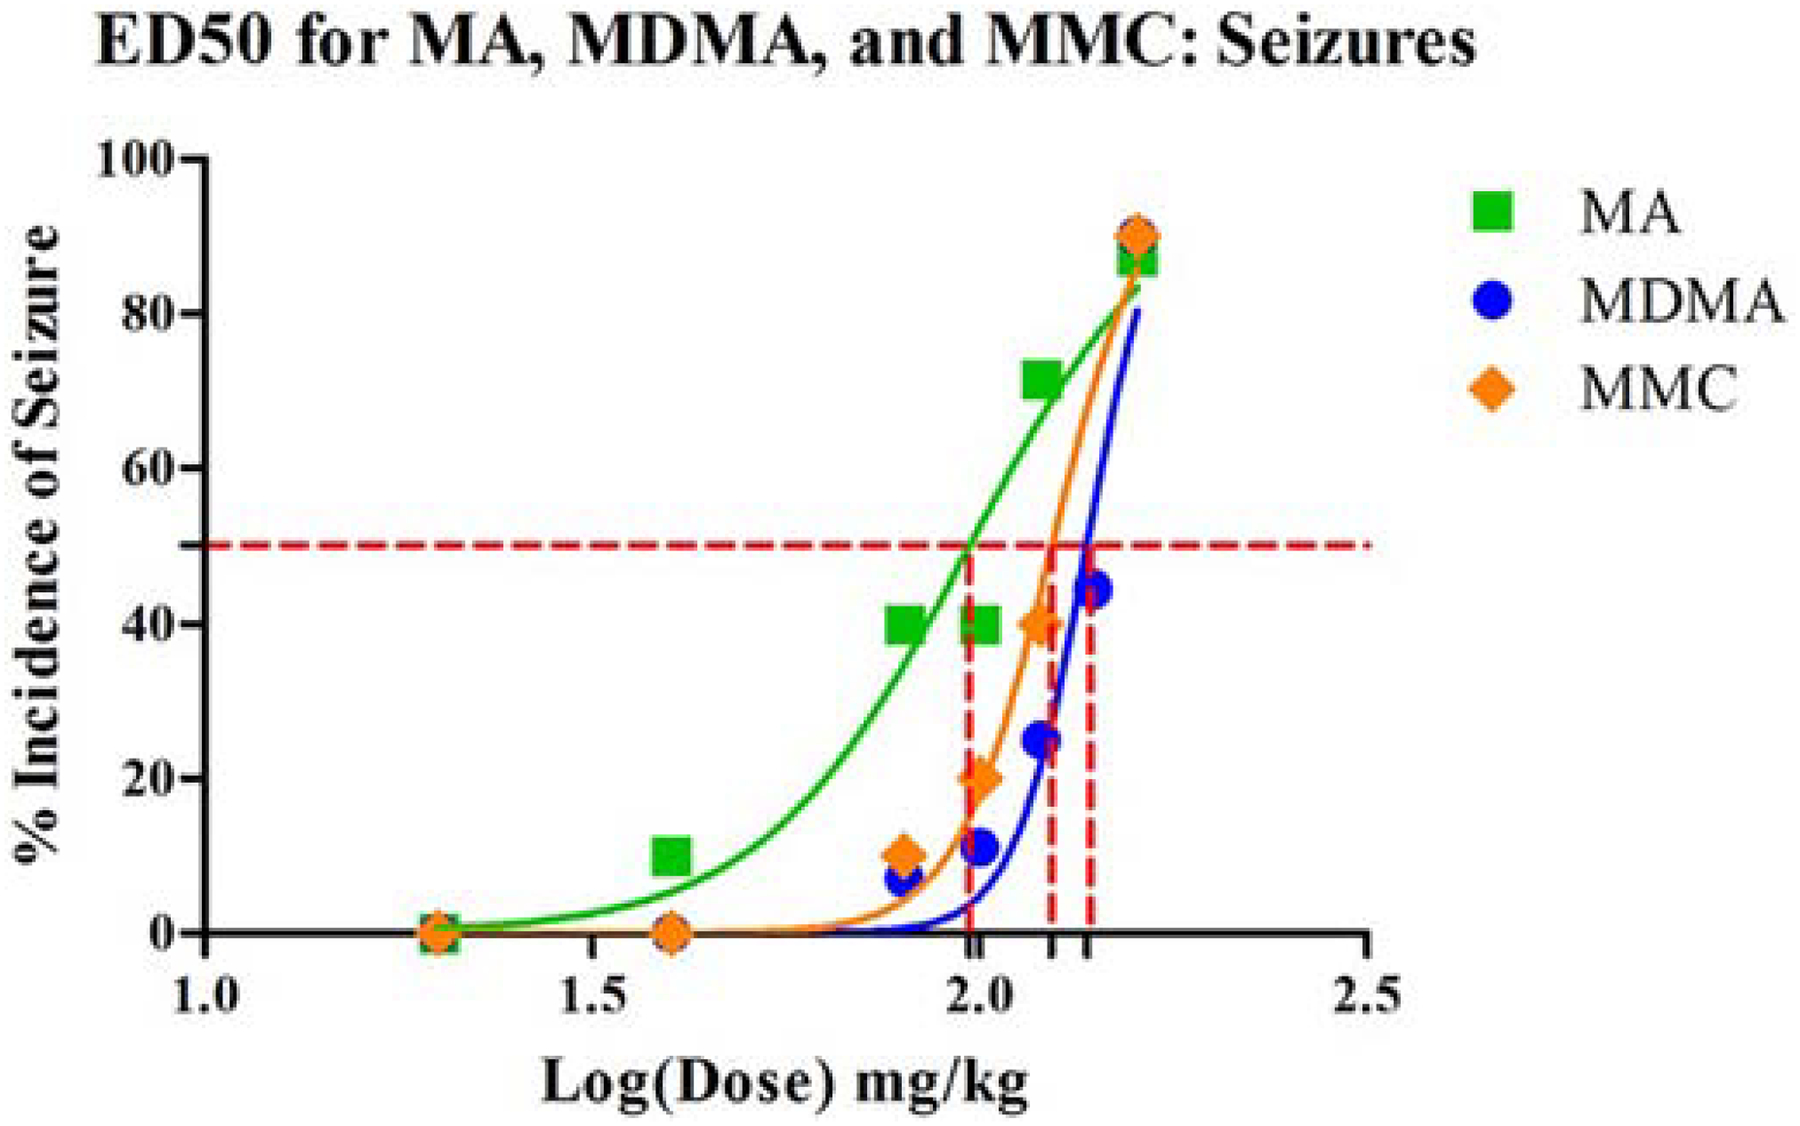
ED50 curves for the incidence of seizure for MA, MDMA an MMC showing relative ED50 values (MDMA>MMC>MA, although all values were similar). Values could not be calculated for CAT, MCAT or MDPV.

ED50 curves for the incidence of seizure for MA, MDMA an MMC showing relative ED50 values (MDMA>MMC>MA, although all values were similar). Values could not be calculated for CAT, MCAT or MDPV.