
Figure 12.
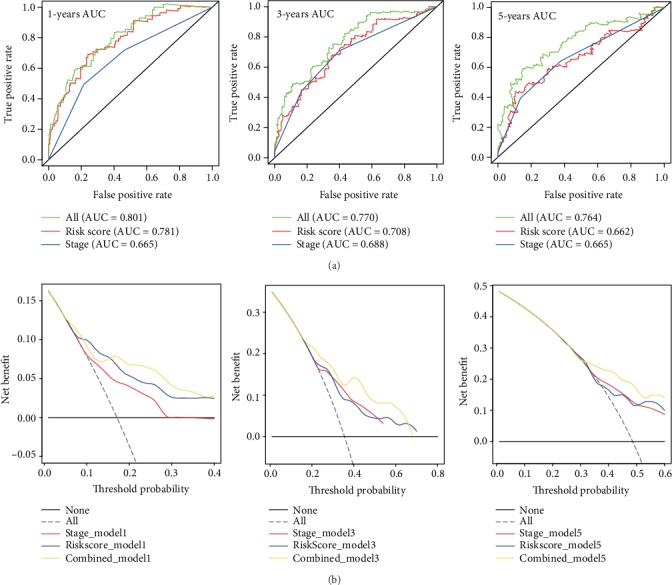
ROC curves of the combined nomogram. (a) ROC curves showed the predictive efficiency of the risk score, TNM stage, and the combined model at 1-year, 3-year, and 5-year survival predictions in the validation dataset. (b) Relations between net benefit and threshold probability at 1-year, 3-year, and 5-year survival predictions.