Figure 3.

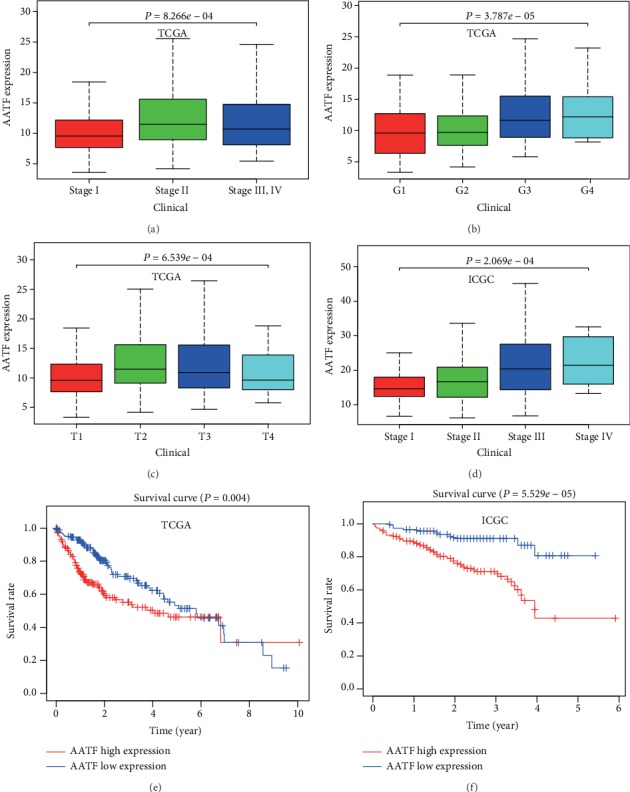
AATF mRNA expression and Kaplan-Meier analysis in the TCGA and ICGC datasets. Comparison of AATF mRNA expression among HCC subgroups divided by TNM stage (a), histopathological grade (b), T stage (c) in the TCGA dataset and by TNM stage in the ICGC dataset (d). Kaplan-Meier analysis was conducted for patients who were assigned to high-and low-risk groups by the AATF expression level in the TCGA (e) and ICGC (f) datasets. Patients with a higher AATF mRNA expression had a poorer prognosis.
