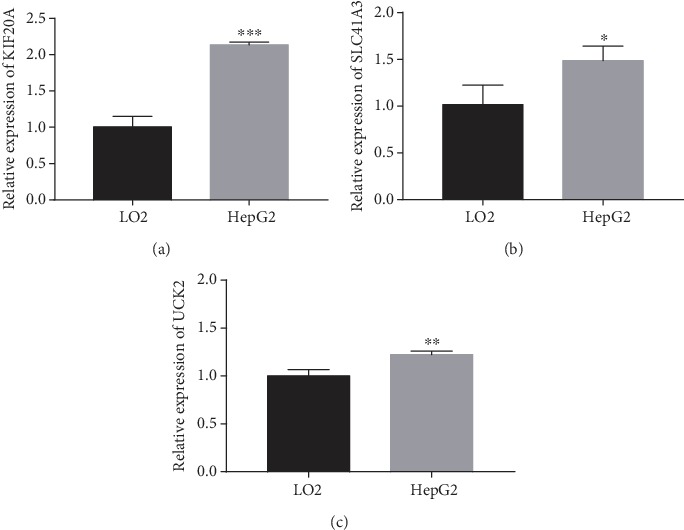
Figure 7.

Comparison of mRNA expression between an HCC cell line (HepG2) and normal a liver cell line (LO2) on KIF20A, SLC41A3, and UCK2. (a) KIF20A mRNA expressions in two cell lines. (b) SLC41A3 mRNA expressions in two cell lines. (c) UCK2 mRNA expressions in two cell lines. ∗P < 0.05; ∗∗P < 0.01; ∗∗∗P < 0.001.
