
Figure 2.
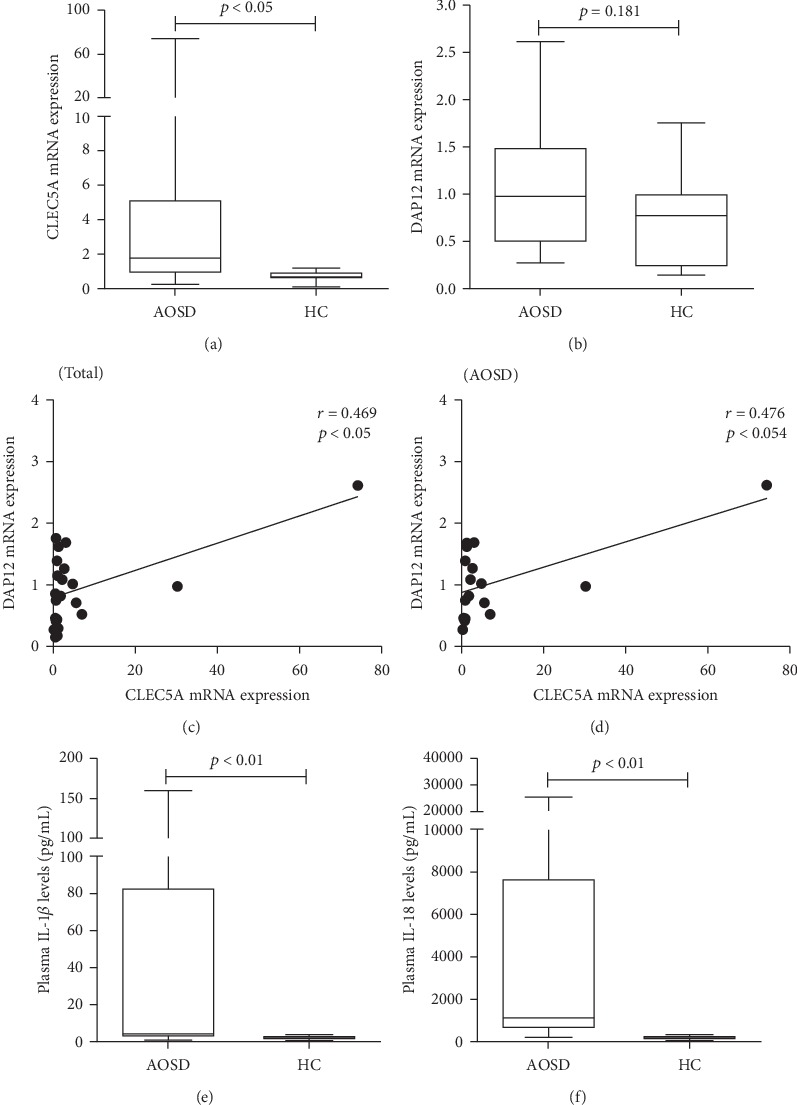
The mRNA expression levels of CLEC5A and DAP12 and the level of inflammasome-related cytokines IL-1β and IL-18 in patients with AOSD. The comparisons of relative mRNA expression levels of CLEC5A and DAP12 on PBMCs ((a) and (b), respectively) between 17 AOSD patients and 9 healthy subjects. The horizontal line indicates the median value for each group. The correlation between CLEC5A expression and DAP12 expression in all subjects (c) or AOSD patients (d). Correlation coefficients (γ) and p value were obtained by the nonparametric Spearman's rank correlation test. The comparisons in plasma levels of proinflammatory cytokines including IL-1β (e) and IL-18 (f) from active AOSD patients and healthy controls (HC). The data are presented as box-plot diagrams, in which the box encompasses the 25th percentile (lower bar) to the 75th percentile (upper bar). The horizontal line within the box indicates the median value for each group. The p values were determined by using the nonparametric Mann-Whitney U test. CLEC5A: C-type lectin domain family 5-member A; DAP12: DNAX activation protein 12; AOSD: adult-onset Still's disease; PBMCs: peripheral blood mononuclear cells.