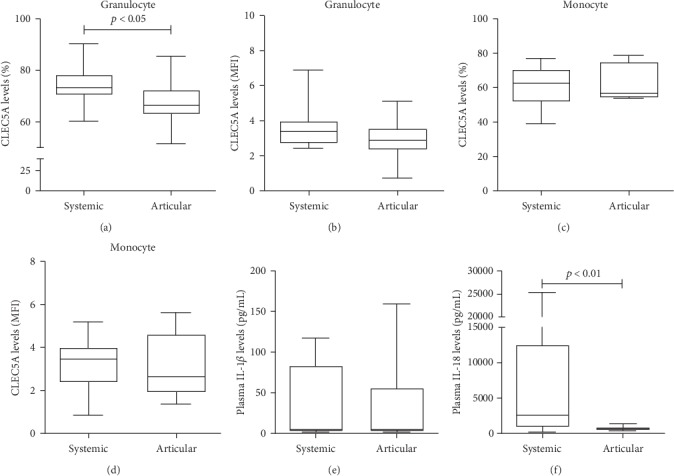
Figure 4.

The differences in CLEC5A levels and plasma cytokine levels in AOSD patients with different patterns of disease course. The differences in the percentages and MFI of CLEC5A-expressing granulocytes ((a) and (b), respectively) or monocytes ((c) and (d), respectively), and plasma levels of IL-1β (e) and IL-18 (f) in AOSD patients with different patterns of disease course. Data are presented as box-plot diagrams, with the box encompassing the 25th percentile (lower bar) to the 75th percentile (upper bar). The horizontal line within the box indicates median value, respectively, for each group. The p values were determined by the Mann-Whitney U test.
