
Figure 1.
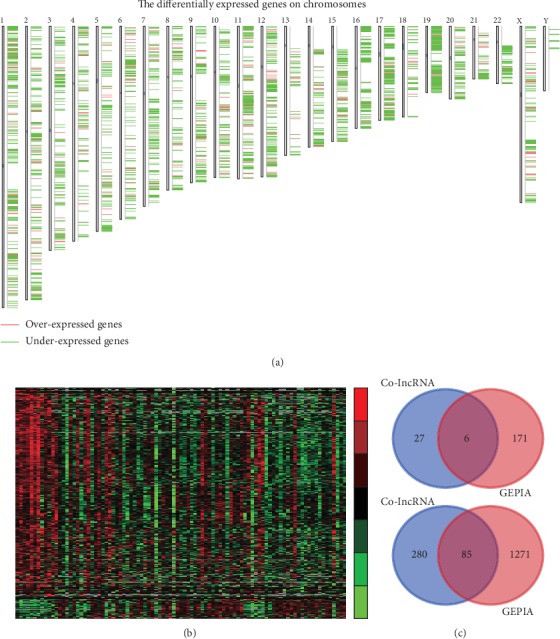
Identification of differently expressed lncRNAs in TC. (a) Chromosomal distribution of differently expressed genes in TC tissues using GEPIA database. (b) Hierarchical clustering analysis shows differential lncRNA expression between normal and TC samples by using Co-lncRNA database. (c, d) Venn diagrams display differently expressed lncRNAs in both databases.