
Figure 2.
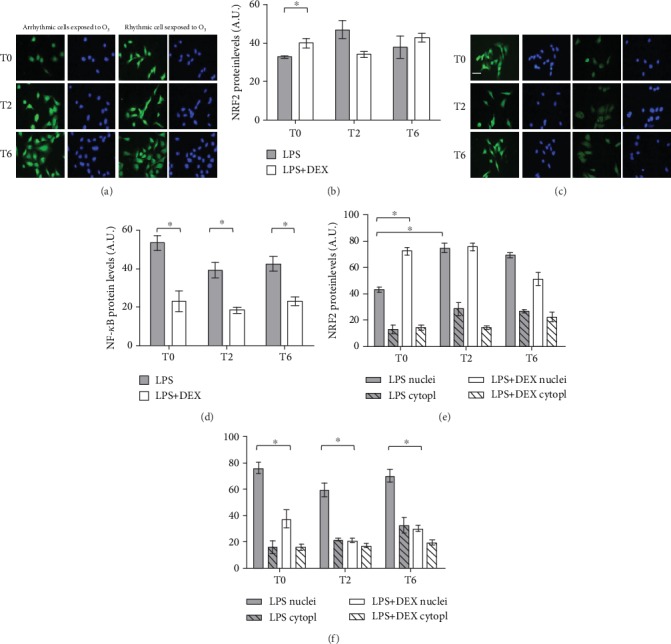
Immunofluorescence for NRF2 and NF-κB in dex-synchronized HaCaT cells and arrhythmic ones chronically inflamed with LPS 1 μg/ml and exposed to O3. Representative pictures of three different experiments are presented. Nuclei (blue) were stained with DAPI. Magnification 40x, scale bar = 50 μm. Samples were harvested at different time points (0, 2, and 6 hours after ozone exposure). Quantification of fluorescence in total HaCaT cells (b, d), cytoplasm, and nucleus fractions (e, f) of NRF2 and NF-κB proteins is shown. Data are expressed as mean ± SEM from three independent experiments. ∗P < 0.05.