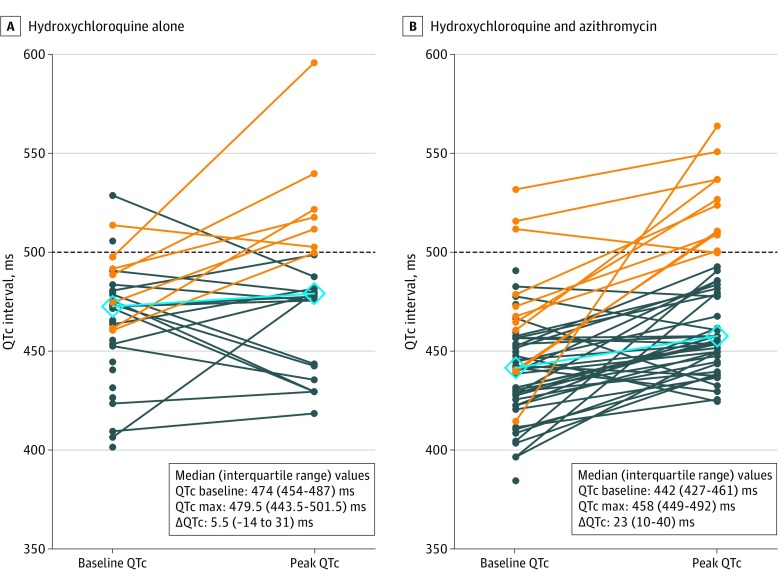
Figure. Individual Changes in Corrected QT (QTc) Interval .
Difference in QTc between individuals at baseline and after use of hydroxychloroquine (A) or hydroxychloroquine and azithromycin (B). Orange lines denote a postadministration QTc of 500 milliseconds or more (while dark blue lines indicate values less than this threshold), and the light blue line with diamonds indicates the median baseline and peak QTc values after drug administration. Max indicates maximum; ΔQTc, change in corrected QT interval.

