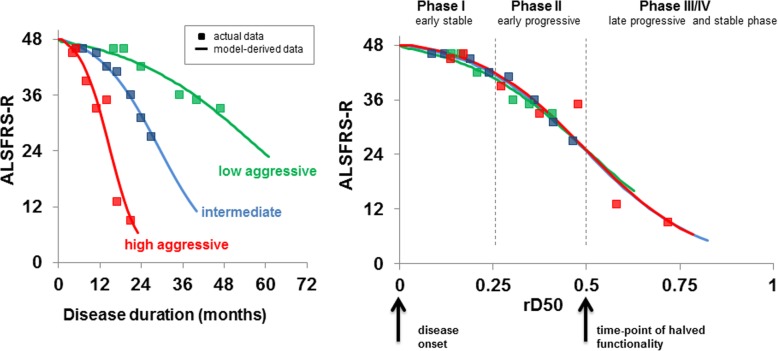
Fig. 1.
The D50 model and rD50-derived disease phases. The model yields three key descriptive parameters: D50 as the time taken in months for ALSFRS-score to drop to 24 points, dx as the time constant of ALSFRS-R decay, and the rD50, which describes individual disease course covered in reference to D50. a D50 and dx are calculated from actual ALSFRS-R scores for 3 representative patients with distinct disease profiles; high, moderate, and low disease aggressiveness. b Normalization with rD50 allows for comparability between patients with vastly different disease time scales and shows that patients proceed through similar phases of functional decline independent of individual disease aggressiveness

