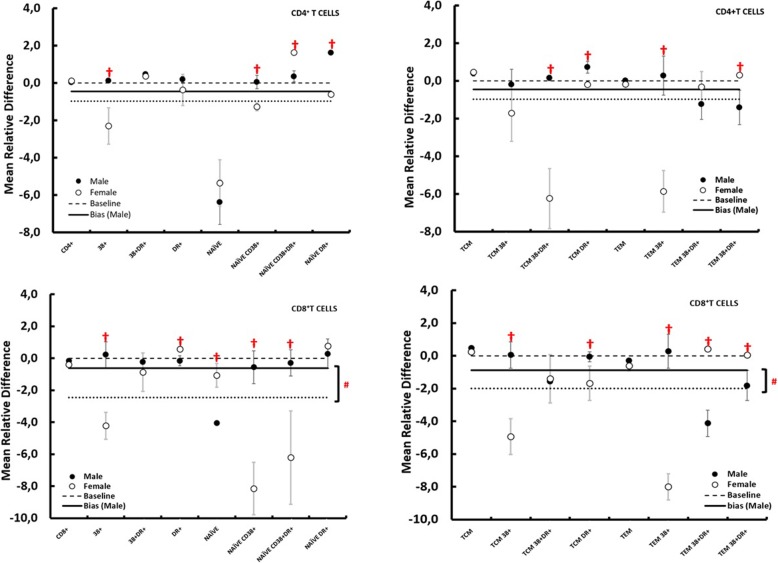
Fig. 2.
Differences in immune-activation markers between men and women. Ranked mean relative differences (MRD) for male (black-filled circle) and female (gray open circle) for each marker. Vertical bars indicate the errors. The errors on the MRD are calculated with standard error propagation. The same axis value ranges were used in each case for ease of comparison. The dotted line markers the case of zero difference between the marker measurement in the peripheral blood and in the GUT. P values are significant: bias male vs. bias female (#) P < 0.05; immune activation markers: man vs. women (†) P < 0.05

